Hypernetx-Widget
Overview
The HyperNetXWidget is an addon for HNX, which extends the built-in visualization capabilities of HNX to a JavaScript based interactive visualization. The tool has two main interfaces, the hypergraph visualization and the nodes & edges panel. You may demo the widget here.
The HypernetxWidget is open source and available on GitHub It is also published on PyPi
The HyperNetX widget is currently in beta with limitations on the Jupyter environment in which it may be used. It is being actively worked on. Look for improvements and an expanded list of usable environments in a future release.
Installation
HyperNetXWidget is currently in beta and will only work on Jupyter Notebook 6.5.x. It is not supported on Jupyter Lab, but support for Jupyter Lab is in planning.
In addition, HyperNetXWidget must be installed using the Anaconda platform so that the widget can render on Jupyter notebook. It is highly recommended to use the base environment provided by Anaconda because Anaconda’s package management system, conda, will resolve dependencies when HyperNetX and HyperNetXWidget are installed. For more information on conda environments, please see their documentation here.
Do not use python’s built-in venv module or virtualenv to create a virtual environment; the widget will not render on Jupyter notebook.
Prerequisites
conda 23.11.x
python 3.11.x
jupyter notebook 6.5.4
ipywidgets 7.6.5
Installation Steps
Open a new shell and run the following commands:
# update conda
conda update conda

# activate the base environment
conda activate

# install hypernetx and hnxwidget
pip install hypernetx hnxwidget

# install jupyter notebook and extensions
conda install -y -c anaconda notebook
conda install -y -c conda-forge jupyter_contrib_nbextensions

# install and enable the hnxwidget on jupyter
jupyter nbextension install --py --symlink --sys-prefix hnxwidget
jupyter nbextension enable --py --sys-prefix hnxwidget

# install ipykernel and use it to add the base environment to jupyter notebook
conda install -y -c anaconda ipykernel
python -m ipykernel install --user --name=base

# start the notebook
jupyter-notebook
Conda Environment
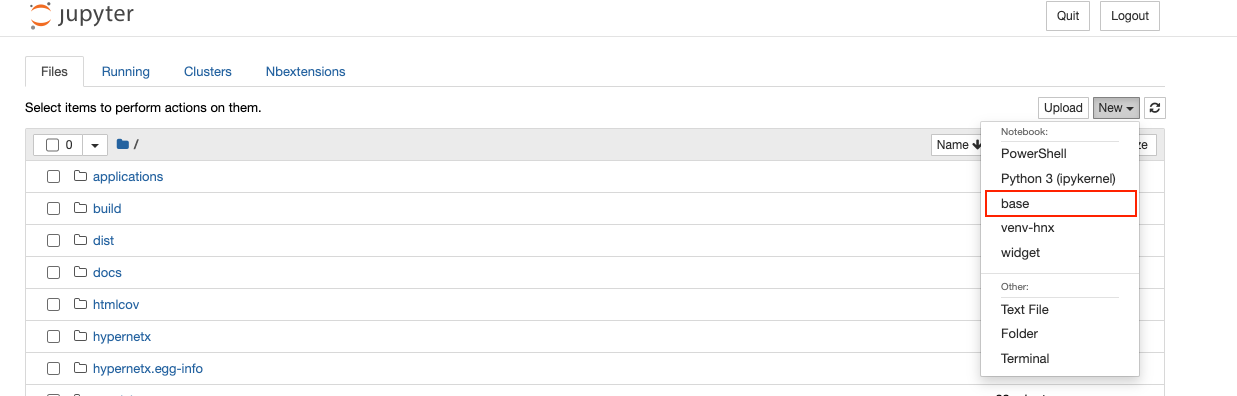
If the notebook runs into a ModuleNotFoundError for the HyperNetX or HyperNetXWidget packages, ensure that you set your kernel to the conda base environment (i.e. base). This will ensure that your notebook has the right environment to run the widget.
On the notebook, click the “New” drop-down button and select “base” as the environment for your notebook. See the following screenshot as an example:
Using the Tool
Layout
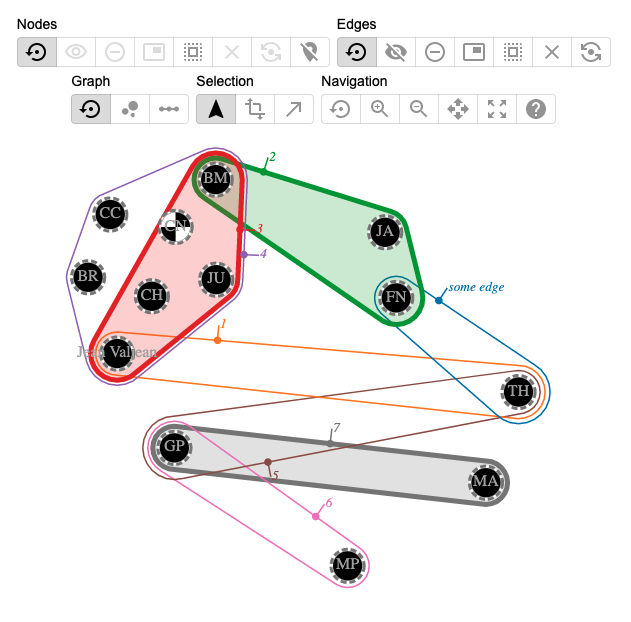
The hypergraph visualization is an Euler diagram that shows nodes as circles and hyper edges as outlines containing the nodes/circles they contain. The visualization uses a force directed optimization to perform the layout. This algorithm is not perfect and sometimes gives results that the user might want to improve upon. The visualization allows the user to drag nodes and position them directly at any time. The algorithm will re-position any nodes that are not specified by the user. Ctrl (Windows) or Command (Mac) clicking a node will release a pinned node it to be re-positioned by the algorithm.
Selection
Nodes and edges can be selected by clicking them. Nodes and edges can be selected independently of each other, i.e., it is possible to select an edge without selecting the nodes it contains. Multiple nodes and edges can be selected, by holding down Shift while clicking. Shift clicking an already selected node will de-select it. Clicking the background will de-select all nodes and edges. Dragging a selected node will drag all selected nodes, keeping their relative placement. Selected nodes can be hidden (having their appearance minimized) or removed completely from the visualization. Hiding a node or edge will not cause a change in the layout, wheras removing a node or edge will. The selection can also be expanded. Buttons in the toolbar allow for selecting all nodes contained within selected edges, and selecting all edges containing any selected nodes. The toolbar also contains buttons to select all nodes (or edges), un-select all nodes (or edges), or reverse the selected nodes (or edges). An advanced user might:
Select all nodes not in an edge by: select an edge, select all nodes in that edge, then reverse the selected nodes to select every node not in that edge.
Traverse the graph by: selecting a start node, then alternating select all edges containing selected nodes and selecting all nodes within selected edges
Pin Everything by: hitting the button to select all nodes, then drag any node slightly to activate the pinning for all nodes.
Side Panel
Details on nodes and edges are visible in the side panel. For both nodes and edges, a table shows the node name, degree (or size for edges), its selection state, removed state, and color. These properties can also be controlled directly from this panel. The color of nodes and edges can be set in bulk here as well, for example, coloring by degree.
Other Features
Nodes with identical edge membership can be collapsed into a super node, which can be helpful for larger hypergraphs. Dragging any node in a super node will drag the entire super node. This feature is available as a toggle in the nodes panel.
The hypergraph can also be visualized as a bipartite graph (similar to a traditional node-link diagram). Toggling this feature will preserve the locations of the nodes between the bipartite and the Euler diagrams.