Utility Rate checks verify that utility rates from the approved source were used for all applicable fuels,
that the required supporting information is included in the submittal, and that modeling inputs and
outputs reflect the reported rate structure. Table 4 summarizes the checks included in the Utility Rates
section. This group of checks may be skipped if project documents compliance using unit other than
energy cost, such as site or source energy or emissions, which may be allowed by some rating
authorities and jurisdictions.
Legend: PASS/FAIL/NA outcome is determined
automatically in the Quality Control Checks tab of the Compliance Form.
UR01 The utility rate for electricity, natural gas and other applicable energy sources are based on
the approved source
90.1 2016 and 2019/2022 ECB
11.4.3.2/12.4.3.2: The rates for purchased energy (such as electricity, gas, oil,
propane, steam and chilled water) must be approved by the AHJ.
90.1 2016 and 2019/2022 PRM
Section G2.4.2: Either the actual rates for purchased energy or state average energy
prices published by U.S. Energy Information Administration (EIA) for commercial building customers may
be used, but rates from different sources may not be mixed in the same project.
Review Tips
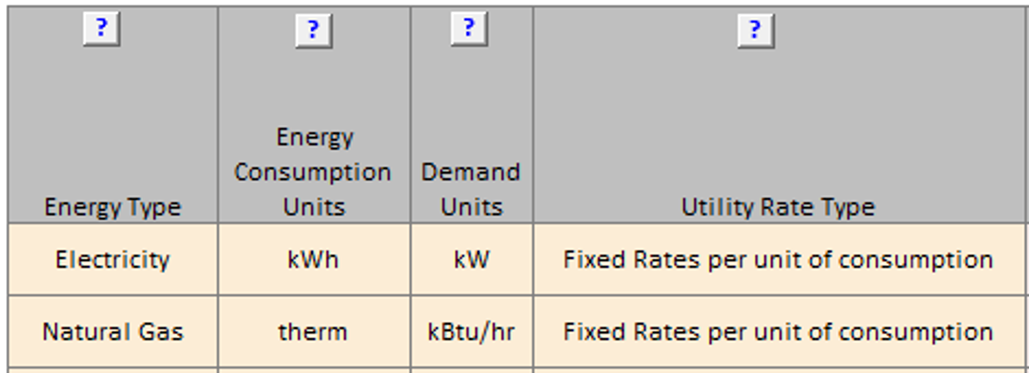
All fuels applicable to the baseline/budget or proposed design must be listed on the Energy Sources tab
of the Compliance Form. Table 1 includes the list of fuels and description of utility rates for each.
The fee structures for each fuel is further described in Tables 2-4 of the Energy Sources tab.
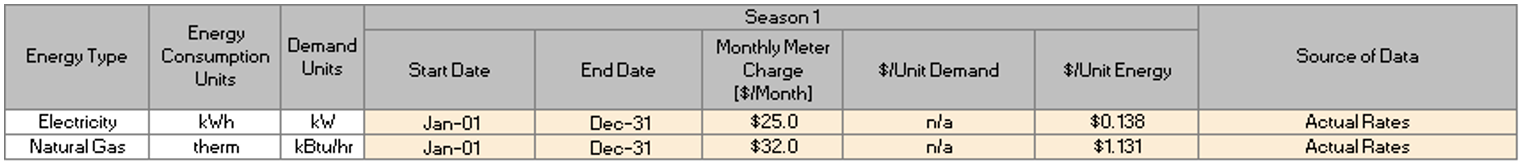
Table 2 is used for reporting rates that have uniform charges, Table 3 for time of use charges,
Table 4 for block charges. These tables also list Source of Data for each rate which may include
Actual Rates, EIA Rates or Other.
With the EIA option, the most recent annual average rates for electricity and natural gas published
at the EIA website should be used. These rates are readily available and are simple usage charges such
as $/kWh.
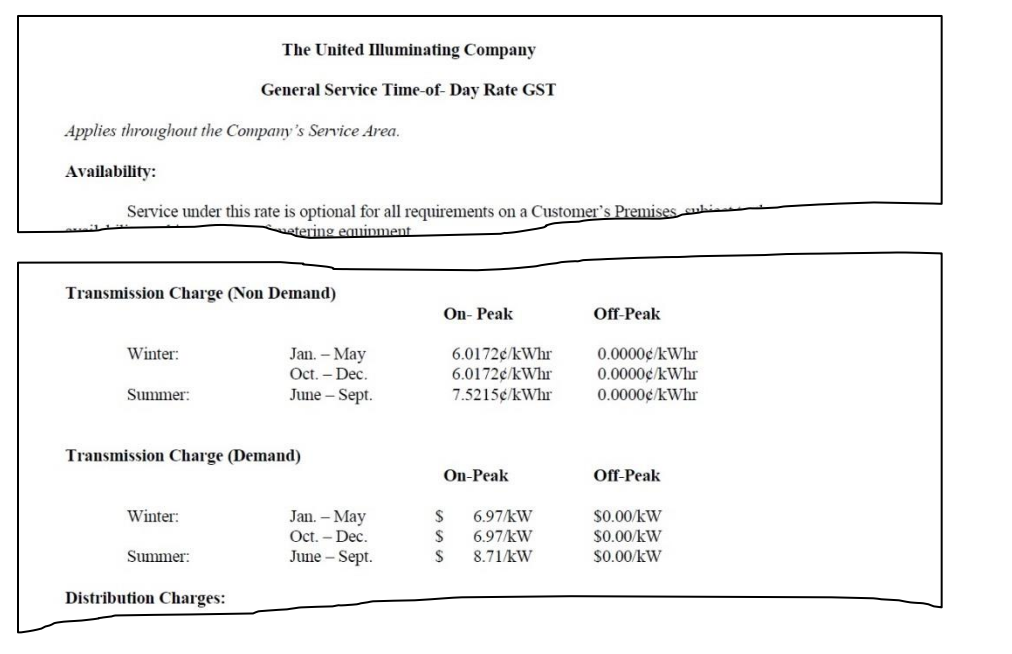
The actual rates may be more challenging to establish for a new construction project, as several different
rate classes and choice of electricity suppliers may apply. The actual rates may also be harder to
model as they often include block charges, time of use charges, demand charges, ratchet clauses, etc.
However, using the actual rates makes models more representative of the post-occupancy energy costs
and allows capturing impact of electricity demand and time of use on compliance.
If actual utility rates are used on the project, the supporting information should be included in the
submittal (Submittal Checklist #7), such as rate description from the utility company.
UR02 The difference between the average (virtual) modeled budget/baseline and proposed utility rates
for electricity, natural gas and other applicable energy sources are as expected.
Review Tips
Background
The average annual rate, often referred to as the virtual rate, is calculated for each fuel as the
ratio of the annual fuel consumption to the annual fuel cost. For example, if the simulation output
reports show that the baseline annual electricity use was 509,150 kWh and the annual electricity cost
was $76,370, the virtual electricity rate is $76,370 / 509,150kWh = 0.15 $/kWh.
For projects that used EIA rates or the actual rates with fixed usage charges (e.g. $/kWh, $/Therm) and
no demand, time of use, or block charges, the virtual rate is expected to be the same for the
budget/baseline and the proposed design and match the rate reported on the Energy Sources tab of the
Compliance Form. For projects that use more complex utility rate structures, virtual rates may differ
between the budget/baseline and proposed design. For example, the virtual electricity rate for the proposed
design may be lower than for the budget (baseline) design if the proposed design reduces the peak demand and
the modeled electricity rates include demand charges.
Virtual utility rates for the budget/baseline and proposed design that are not equal for projects with simple
utility rate structures or differ by more than 5% for projects with complex utility rate structures, should be
flagged.
UR03 The modeled utility rates for electricity, natural gas and other fuels applicable to the
project are as reported in the Compliance Form and are the same in the baseline/budget and proposed
design model.
Review Tips
Review input and output reports to confirm that the utility rate structure described in the
submittal was properly modeled. This QC check should be performed if UR02 check fails or instead
of UR02.
eQUEST
ES-D, ES-E, ES-F
Trane TRACE 700
Library Members entered values report Utility rates section for utility rate input, Monthly Energy
Consumption and Monthly Utility Cost reports for consumption and cost output
Trane TRACE 3D Plus
Site Consumption Summary report for energy consumption for each fuel and Economic
and Life Cycle Costs Summary report for consumption costs for each fuel
IESVE
Energy Model Output Report, PRM Compliance Report, ECB Compliance Report, BPRM
Report, ASHRAE 90.1-2016 PCI Report
EnergyPlus
eplustbl.html ‘Tariff Report’ report
OpenStudio
Not Applicable
Carrier HAP v5
“Electric Rate Inputs”, “Fuel Rate Inputs” reports. Virtual rate found on “Billing Details” report,
generated by energy or fuel source.
Design Builder
Utility:Tariffs sections in Input Data file (.idf)
How to Use the Filter Feature
How do I use the Filter feature?
Click on the orange Filter Content button at the top of the page.
By default, all options are selected. To filter for your specific project, first uncheck the project path, 90.1 vintages, and model types that are not applicable.
Then select from the dropdowns the Check Type(s), Component Type(s), and BEM Tool(s) that are applicable.
After filtering, checks that are not applicable will be grayed out at the top of the page; only applicable checks remain visible as you scroll.
To reset and show all content again, click the Reset Filters button.