Simulation General (SG)
Overview of Simulation General Checks
Simulation General checks help gauge the general quality of the submittal, such as whether an approved simulation tool and weather file were used, modeled floor area reflects design documents, and simulation results reported in the Compliance Form reflect simulation output reports.
In addition, there are checks that compare modeled energy use of the baseline/budget and proposed design to the selected benchmarks to verify that the simulation results are reasonable. The relevant information is shown on the Energy Performance Summary tab of the Compliance Form in both the tabular and graphical format (Figure 9). Significant deviations between the modeled energy use intensities of the baseline/budget and proposed design and the benchmark should be flagged, as discussed in the specific checks described below.
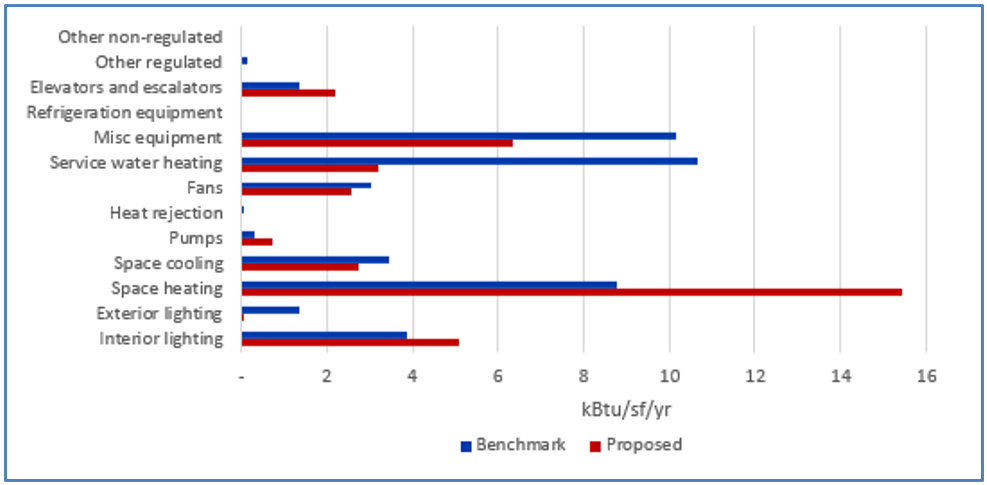
Of especial concern are the instances when the baseline/budget EUI is significantly higher than the benchmark or proposed EUI is significantly lower than the benchmark as it may result in overly optimistic compliance outcome.
However, the differences may be justified by different operating conditions (e.g., longer daily operating hours) between the project and the benchmark and the building use (e.g., school project that has a swimming pool versus school benchmark with no swimming pool). The configurations of the benchmarks are summarized in the scorecards which can be downloaded at the DOE Building Energy Codes Program website. In addition, a large difference may be acceptable for end uses that account for a small percentage of energy use in both benchmark and completed models, such as heating energy use in Miami or cooling energy use in Alaska.
Table 3 summarizes the checks included in the Simulation General section.
Table 3: Simulation General (SG) Checks Overview
| Focus of the Check | Type of Check | Proposed Design | Baseline/Budget Design |
|---|---|---|---|
| Simulation Tools | General requirements of ECB/PRM | SG01 | SG01 |
| Climate Zone | General requirements of ECB/PRM | SG02 | SG02 |
| Weather File | General requirements of ECB/PRM | SG03 | SG03 |
| Floor Area | CF inputs reflect design documents | SG04 | NA |
| Simulation inputs consistent with CF | SG05 | SG05 | |
| Number of hours per year explicitly modeled | Simulation inputs consistent with CF | SG06 | SG06 |
| Unmet load hours | CF inputs reflect requirements of ECB/PRM | SG07 | SG07 |
| Simulation outputs consistent with CF | SG08 | SG08 | |
| Energy Use | Simulation outputs consistent with CF | SG09-P | SG09-B |
| Total EUI | Simulation outputs consistent with benchmark | SG10-P | SG10-B |
| Interior Lighting EUI | Simulation outputs consistent with benchmark | SG11-P | SG11-B |
| Miscellaneous and Process EUI | Simulation outputs consistent with benchmark | SG12-P | SG12-B |
| Space Heating EUI | Simulation outputs consistent with benchmark | SG13-P | SG13-B |
| Space Cooling EUI | Simulation outputs consistent with benchmark | SG14-P | SG14-B |
| Ventilation Fans EUI | Simulation outputs consistent with benchmark | SG15-P | SG15-B |
| HVAC Pumps EUI | Simulation outputs consistent with benchmark | SG16-P | SG16-B |
| Heat Rejection EUI | Simulation outputs consistent with benchmark | SG17-P | SG17-B |
| Service Water Heating EUI | Simulation outputs consistent with benchmark | SG18-P | SG18-B |
| Elevator EUI | Simulation outputs consistent with benchmark | SG19-P | SG19-B |
| Compliance Calculations | CF inputs reflect requirements of ECB/PRM | SG20 | SG20 |
| Legend: PASS/FAIL/NA outcome is determined automatically in the Quality Control Checks tab of the Compliance Form. | |||
SG01 The Same Approved Simulation Program Used for the Baseline/Budget and Proposed Design Models
90.1 2016 and 2019 ECB
Section 11.4.1: The simulation program must be approved by the adopting authority and have the following capabilities:
- Explicitly support simulation methods, systems, and components listed in Section 11.4.1.1, such as hourly variations in occupancy, lighting power, miscellaneous equipment power, thermostat set points, and HVAC system operation, defined separately for each day of the week and holidays; thermal mass effects; ten or more thermal zones; part-load performance curves for mechanical equipment; capacity and efficiency correction curves for mechanical heating and mechanical cooling equipment; air-side economizer and fluid economizer with integrated control; and the budget building design characteristics specified in Section 11.4.5.
- Either directly determine the design energy cost and energy cost budget or produce hourly reports of energy use by energy source suitable for determining the design energy cost and energy cost budget using a separate calculation engine (11.4.1.2).
- Perform design load calculations to determine required HVAC equipment capacities and air and water flow rates in accordance with Section 6.4.2 for both the proposed design and the budget building design.
In addition, the simulation program must be tested according to ASHRAE Standard 140, except for Sections 7 and 8, and the results must be furnished by the software provider (Section 11.4.1.4). In 90.1 2019, the relevant reporting requirements were expanded and clarified as follows:
- The test results and modeler reports must be posted on a publicly available website and include the test results of the simulation program along with the results of the other simulation programs included in ASHRAE Standard 140, Annexes B8 and B16.
- The modeler report in Standard 140, Annex A2, Attachment A2.7 must be completed for results exceeding the maximum or falling below the minimum of the reference values or for missing results.
90.1 2022 ECB
Section 12.4.1: Has requirements similar to 90.1 2016 and 2019 ECB Section 11.4.1 summarized above with the following additions:
- The required ASHRAE Standard 140 tests are specified in Section 12.4.1.4 and include building thermal envelope and fabric load tests (Sections 5.2.1, 5.2.2, and 5.2.3), ground coupled slab-on-grade analytical verification tests (Section 5.2.4), space-cooling equipment performance tests (Section 5.3), space-heating equipment performance tests (Section 5.4), and air-side HVAC equipment analytical verification tests (Section 5.5), along with the associated reporting (Section 6).
- Section 12.4.1.4.3 specifies that the testing shall be performed for the version of the simulation program used to calculate the design energy cost and energy cost budget.
90.1 2016 and 2019 PRM
Section G2.2.1: Has the same requirements as 90.1 2016 and 2019 ECB Section 11.4.1 summarized above.
90.1 2022 PRM
Section G2.2.1: Has the same requirements as 90.1 2022 ECB Section 12.4.1 summarized above.
Review Tips
- Simulation tool name and version is reported in the Energy Model Information section on the
General Information tab of the Compliance Form.
- If AHJ/RA has the list of simulation programs, verify that the simulation program used for the project is on the list.
- If AHJ/RA does not have the list of simulation programs, verify that the simulation program meets the relevant requirements of 90.1 summarized above. The footnote below includes tools listed on the IRS website approved for 179d modeling analysis. An individual AHJ/RA may allow only some of these tools, a subset of versions for each program, or simulation tools not listed on the IRS website.
- If it is determined that the simulation program used on the project is not approved, it is recommended that the issue is resolved before proceeding with other checks described in the manual. Alternatively, only the checks that do not involve verifying simulation inputs or outputs should be completed.
SG02 Project Climate Zone Reported in the Compliance Form is Established Correctly
90.1 2016, 2019, and 2022 ECB and PRM
Section 5.1.4 (5.1.5 in 90.1 2022): Use ASHRAE Standard 169, Table B-1, “U.S. Climate Zones by State and County,” Table A-5, “Canada Stations and Climate Zones,” and Table A-6, “International Stations and Climate Zones,” to determine the assigned climate zone and, where required, the assigned climate zone letter. If there are recorded historical climatic data available for a construction site, they may be used to determine compliance if approved by the building official. The information is also included in 90.1 Annex 1, which contains the relevant abstracts from ASHRAE Standard 169.
Review Tips
- Project address is listed in the Project Information section of the Contact Information tab of
the Compliance Form. Use the reported zip code to determine the county.
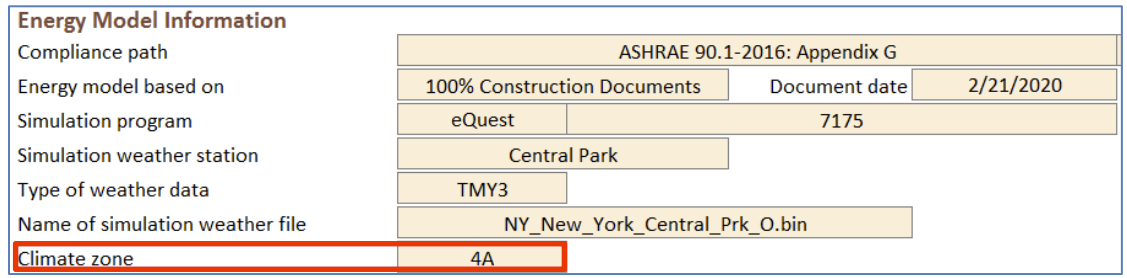
- Refer to 90.1 Annex 1 to confirm that the climate zone listed on the General Information tab,
Energy Model Information section is established correctly based on the state and county where
the project is located.
SG03 The Same Approved Weather File Used in the Baseline/Budget and Proposed Simulation
90.1 2016 and 2019/2022 ECB
Section 11.4.2/12.4.2: The simulation must be performed using hourly values of climatic data, such as temperature and humidity from representative climatic data, for the city in which the proposed design is to be located. For cities or urban regions with several climatic data entries, and for locations where weather data are not available, the designer must select available weather data that best represents the climate at the construction site.
Section 11.4.4/12.4.4: The same weather file must be used for the budget (baseline) and proposed design simulations.
90.1 2016, 2019, and 2022 PRM
G2.3: The simulation must be performed using hourly values of climatic data, such as temperature and humidity from representative climatic data, for the city in which the proposed design is to be located. For cities or urban regions with several climatic data entries, and for locations where weather data are not available, the designer must select available weather data that best represents the climate at the construction site.
G2.1: The same weather file must be used for the budget (baseline) and proposed design simulations.
Review Tips
- Weather file used in the simulation is reported in the General Information tab of the compliance
Form.
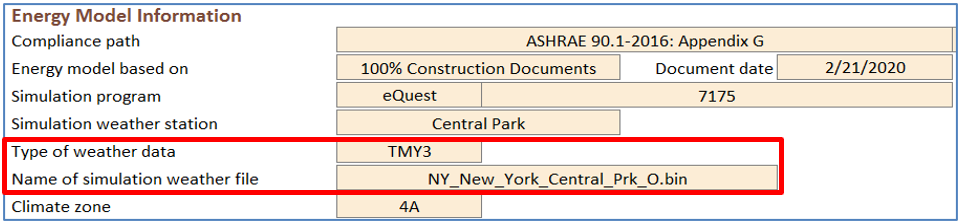
- If AHJ/RA has pre-approved weather files that must be used for specific project locations, confirm that the weather file listed in the Compliance Form and in the model is approved.
- If AHJ/RA does not have pre-approved weather files, as a general rule projects should use a weather file for the Typical Meteorological Year (TMY) station closest to the project site. In areas with large elevation changes or microclimates, the closest station may be at a significantly different elevation and therefore have different weather or psychrometric characteristics or may be in a different microclimate. In such cases, a weather station at similar elevation and latitude or similar microclimate may be a better fit.
- Once the weather station is determined, TMY2, TMY3, or TMYx data files for the selected station should be used (for projects located in the United States). TMYx data reflects more recent weather patterns compared to TMY3 and TMY2 data. Alternative weather data sources, such as those accounting for expected climate change, may be allowed with sufficient supporting documentation.
- The same weather file must be used for the budget/baseline and proposed design simulations.
eQUESTBEPS and at the top of other reportsTrane TRACE 700Title Page report (the same weather file will always be used for both alternatives)Trane TRACE 3D PlusClimatic Summary reportIESVEPRM Compliance Report, ECB Compliance Report, BPRM Report, IECC Compliance Report, Detailed Simulation Report, Energy Model Output ReportEnergyPluseplustbl.html ‘Top’ sectionEnergyPlus HTML output file > Input Verification and Results Summary report > General table > “Weather File”OpenStudioeplustbl.html ‘Top’ section; EnergyPlus HTML output file > Input Verification and Results Summary report > General table > “Weather File”Carrier HAP v5Simulation Weather Summary Report (The same simulation weather file will always be used for both Proposed and Baseline in the same project. It is not possible to use different simulation weather data for Proposed and Baseline in a single project)Design BuilderEnergyPlus Output Summary Document
SG04 The Reported Project Floor Area is Consistent with the Design Documents
90.1 2016 and 2019/2022 ECB
Table 11.5.1/12.5.1 Column A, #1a: The simulation model of the proposed design must be consistent with the design documents; thus, the modeled project area is expected to be as designed.
90.1 2016, 2019 and 2022 PRM
Table G3.1 Proposed Building Performance column #1a: The simulation model of the proposed design must be consistent with the design documents; thus, the modeled project area is expected to be as designed.
Review Tips
- Check that the project floor area reported in Table 1 of the General Information tab aligns with
the design documents. In addition, check that the classification of the project floor areas
reported in Table 1 on the General Information tab aligns with the design in terms of the floor
area described as “new construction”, “alteration” and “modeled existing to remain – no
alteration” and “conditioned”, “semi-heated and unconditioned”, and “space not enclosed” (click
the help text for definitions).
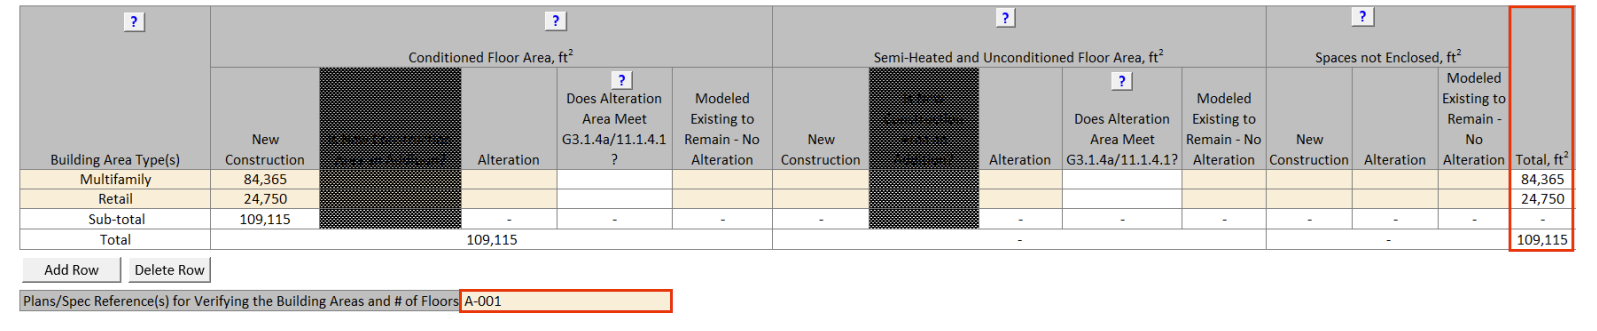
- For 90.1 2022 projects, verify that the selection in the “Does Alteration Area Meet G3.1.4a/11.1.4.1?” column aligns with design documents (click the help text for an explanation of these sections). This selection is important in that it impacts the compliance calculation for PRM projects and, if the answer is “No”, PRM projects must follow 90.1 Section G3.3 instead of Section G3.2.
- Small deviations between the modeled area and the area specified in the design documents are
common and may be acceptable. Below are some common reasons for the mismatch.
- Gross floor area reported in the design documents is based on the definition in the 2015
IBC, which differs from the 90.1 – 2016 definition (both are quoted below). ECB and PRM do
not specify how building area should be inputted into the model, e.g. whether it should be
based on the inside perimeter of the exterior walls (based on the IBC definition), or the
outside perimeter of the exterior walls (90.1 definition), so it may be modeled either way.
Floor Area, Gross (IBC). The floor area within the inside perimeter of the exterior walls of the building under consideration; exclusive of vent shafts and courts, without deductions for corridors, stairways, ramps, closets, the thickness of interior walls, columns or other features. The floor area of a building, or portion thereof, not provided with surrounding exterior walls shall be the usable area under the horizontal projection of the roof of floor above. The gross floor area shall not include shafts with no openings or interior courts.
Floor Area, Gross (90.1): the sum of the floor areas of the spaces within the building, including basements, mezzanine and intermediate-floored tiers and penthouses with a headroom height of 7.5 ft or greater. It is measured from the exterior faces of walls or from the centerline of walls separating buildings, but excludes covered walkways, open roofed-over areas, porches and similar spaces, pipe trenches, exterior terraces or steps, chimneys, roof overhangs, and similar features. - 90.1 distinguishes between enclosed spaces, which include directly or indirectly conditioned, semi-heated, or unconditioned spaces and un-enclosed spaces, such as crawlspaces, attics, and parking garages with natural or mechanical ventilation (see 90.1 definition of unconditioned space). Un-enclosed spaces may be modeled with ambient conditions, thus not contributing to the modeled floor area.
- Multilevel spaces such as stairwells may be modeled as an open shaft (i.e., modeled area = area of the footprint), or as multiple floors (modeled area = area of the footprint times the number of floors the space spans).
- To ensure a fair comparison between the floor areas shown in the simulation reports and the design documents, it’s important to understand how the floor area is reported by the simulation tool. For example, certain simulation reports may show conditioned floor area, others the gross floor area including unconditioned spaces and plenums, etc.
- Gross floor area reported in the design documents is based on the definition in the 2015
IBC, which differs from the 90.1 – 2016 definition (both are quoted below). ECB and PRM do
not specify how building area should be inputted into the model, e.g. whether it should be
based on the inside perimeter of the exterior walls (based on the IBC definition), or the
outside perimeter of the exterior walls (90.1 definition), so it may be modeled either way.
+/- 5% difference between the modeled floor area of heated and cooled spaces and the area of the corresponding spaces listed in the design documents may be acceptable. Higher deviations may be permitted with an appropriate explanation.
SG05 The Modeled Floor Area is as Reported in the Compliance Form and the Same Between Budget/Baseline and Proposed Design
90.1 2016 and 2019/2022 ECB
Table 11.5.1/12.5.1 Column B, #1a: The baseline building design shall be modeled with the same number of floors and floor area as the proposed design.
90.1 2016, 2019, and 2022 PRM
Table G3.1 Baseline Building Performance column #1: The baseline building design shall be modeled with the same number of floors and floor area as the proposed design.
Review Tips
1. Use simulation reports listed below to confirm that the modeled project floor area is as reported in the Compliance Form and the same in the baseline/budget and proposed design. Project floor area is reported in Table 1 of the General Information tab
SG06 The Correct Number of Hours Per Year Was Explicitly Modeled
90.1 2016 ECB
11.4.1.1: At least 1,400 hours per year representing the full range of conditions must be explicitly simulated; the same number of hours must be explicitly simulated for the budget and proposed design.
90.1 2019/2022 ECB
11.4.1.1/12.4.1.1: 8,760 hours (full year) must be explicitly simulated.
90.1 2016, 2019 and 2022 PRM
G2.2.1: 8,760 hours (full year) must be explicitly simulated.
Review Tips
- Refer to the simulation reports listed below to confirm that the simulation timestep was as required and the same for both the baseline/budget and proposed design models.
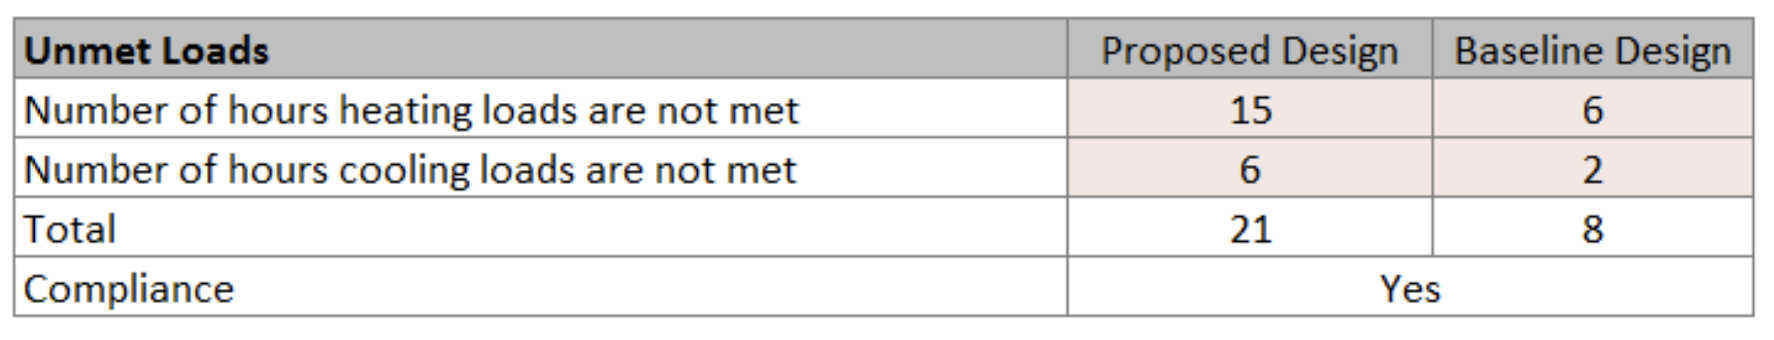
SG07 The Number of Unmet Load Hours Reported in the Compliance Form Does Not Exceed the Prescribed Limits
Section 3: Unmet load hour is an hour in which one or more zones is outside of the thermostat set point plus or minus one half of the temperature control throttling range. Any hour with one or more zones with an unmet cooling load or unmet heating load is defined as an unmet load hour.
90.1 2016 and 2019/2022 ECB
11.5.2 i/12.5.2 i: Unmet load hours for the proposed design or baseline designs shall not exceed 300 hours. In addition, the UMLHs for the proposed design shall not exceed the unmet load hours for the budget building design. Unmet load hours exceeding these limits may be accepted if sufficient justification is given that the accuracy of the simulation is not significantly compromised by these unmet loads. See Section 3 above for the definition of unmet load hour.
90.1 2016 and 2019/2022 PRM
G3.1.2.3/G3.2.2.3: Unmet load hours for the proposed design or baseline building design shall not exceed 300 out of the 8,760 hours simulated. Unmet load hours exceeding these limits may be accepted if sufficient justification is given that the accuracy of the simulation is not significantly compromised by these unmet loads. See Section 3 above for the definition of unmet load hour.
Review Tips
- Unmet load hours (UMLH) are reported in Table 1 on the Compliance Calculations tab of the
Compliance Form.
-
The prescribed limits should be enforced for most projects because high UMLHs are often due to
simulation errors that may have a high impact on the compliance outcome. The higher the UMLHs in
the proposed design compared to the baseline (budget) model effectively means that even though
the two models have the same thermostat setpoints, the actual space temperatures in the proposed
design were lower during the heating season and/or higher during the cooling season. This will
reduce energy use of the proposed design, which is not an allowed trade-off. Below are several
common reasons for a high UMLH.
- The thermostat schedules do not align with the schedules associated with HVAC system operation, occupant schedules, miscellaneous equipment schedules, outside air ventilation schedules and other schedules of operation that could affect the HVAC system’s ability to meet loads in the thermal block.
- The inputs for internal gains, occupants and outside air ventilation are unreasonable and inconsistent with the intended operation of the building.
- The simulated operation of the controls associated with primary or secondary heating or cooling equipment (pumps, coils, boilers, etc.) is out of alignment with the heating and cooling requirements of the building.
- Inadequate equipment capacity in the proposed design. Example: The specified equipment may be intentionally under-sized to achieve higher part load performance, resulting in unmet loads during extreme conditions. In this case, the modeled thermostat setpoints should be adjusted to ensure that the UMLH in the proposed design are within the required limits. Once such the thermostat schedule is established, it must be modeled the same in the baseline/budget and proposed designs.
- Example of extenuating circumstances that may be considered include the following:
-
Number of UMLHs beyond the allowed limit
Reviewer may judge a submittal with 350 UMLHs (that exceed the 300 limit by 50 hours) to be acceptable, but reject a submittal with 800 UMLHs (that exceed the 300 limit by 500 hours). -
Floor area of the thermal blocks where the UMLHs occur
Reviewer may choose to accept a submittal with high UMLHs in a 100 ft2 thermal block (e.g. a stairwell) but reject a submittal with high UMLHs in the zones that account for a notable fraction (e.g. over 5%) of the overall conditioned floor area. -
How far the indoor temperatures drop or rises outside of the acceptable range
For example, the AHJ may accept a submittal if the actual zone temperatures during an UMLH is one or two degrees outside of the throttling range, but reject submittals with larger discrepancies, for example if during the UMLH the temperature in the thermal block is 60F compared to a 70F heating setpoint.
-
Number of UMLHs beyond the allowed limit
Reviewer may request additional simulation reports to substantiate the explanations provided by the modeler.
SG08 The Number of Unmet Load Hours Reported in the Compliance Form Reflects Simulation Results
Review Tips
- Review simulation reports listed below to confirm that the number of unmet load hours reported in the compliance form is aligned with the simulation reports.
SG09-B, SG09-P Energy Use Reported in the Compliance Form Matches Simulation Reports
Review Tips
PRM and ECB compliance is established based on the simulation outputs for the baseline (budget) and proposed design. The Compliance Form allows modelers to copy results from the standard simulation output reports generated by the supported modeling tools into the designated areas to auto-populate the template with the simulation results, to avoid mistakes from manual data transfer. Performing this check should involve the following:
- Confirm that electricity (kWh) and natural gas (Therm) use for the baseline/budget design reported in the Compliance Calculations tab of the compliance form matches the submitted simulation reports.
- Confirm that the total baseline/budget design energy cost reported in the Compliance Calculations tab matches the submitted simulation reports.
- Confirm that electricity (kWh) and natural gas (Therm) use for the proposed design reported in the Compliance Calculations tab matches the submitted simulation reports.
- Confirm that the total proposed energy cost reported in the Compliance Calculations tab matches the submitted simulation reports.
- Spot-check electricity and gas use for individual end uses reported in the compliance form versus simulation reports.
SG10-P Site Energy Use Intensity (EUI) of the Proposed Design is Generally Consistent with the Selected Benchmark
Review Tips
- Refer to 90.1 2022 Section G3.3 Performance Calculations for Other Alterations for notes of caution and tips for alterations subject to 90.1 2022 Section G3.3 (i.e., Minor alterations).
- The benchmarks are selected in Table 4 of the Energy Performance Summary tab in the Compliance Form. See #6 in the Types of Review Checks section for additional information. Table 6 of the Energy Performance Summary tab shows the modeled EUI versus the EUI of the selected benchmark.
- Verify the following:
- If the default benchmark in Table 4 of the Energy Performance Summary tab is overwritten, verify that an appropriate option is selected. (The over-written defaults are shown in brown font.)
- If the default values in columns Table 6 of the Energy Performance Summary tab, the “Acceptable Difference Before QC Flag” columns, the “Total” row are overwritten, confirm that the entered values are justified. (The over-written defaults are shown in brown font.)
- Question results if the difference between the modeled EUI and the benchmark EUI is outside the acceptable limits. Proposed EUI that is below the benchmark is of especial concern as it may indicate inappropriate simulation assumptions or modeling mistakes that result in overly optimistic modeled energy use of the proposed design.
- Higher deviations may be justified by project-specific circumstances, for example if project aims to significantly exceed code and participates in a utility incentive program or pursues LEED or passive house certification or have significantly longer operating hours that the benchmark.
SG10-B Site Energy Use Intensity (EUI) of the Budget/Baseline Design is Generally Consistent with the Selected Benchmark
Review Tips
- Refer to 90.1 2022 Section G3.3 Performance Calculations for Other Alterations for notes of caution and tips for alterations subject to 90.1 2022 Section G3.3 (i.e., Minor alterations).
- The benchmarks are selected in Table 4 of the Energy Performance Summary tab in the Compliance Form. See #6 in the Types of Review Checks section for additional information. Table 6 of the Energy Performance Summary tab shows the modeled EUI versus the EUI of the selected benchmark.
- Verify the following:
- If the default benchmark in Table 4 of the Energy Performance Summary tab is overwritten, verify that an appropriate option is selected. (The over-written defaults are shown in brown font.)
- If the default values in columns Table 7 of the Energy Performance Summary tab, the “Acceptable Difference Before QC Flag” columns, the “Total” row are overwritten, confirm that the entered values are justified. (The over-written defaults are shown in brown font.)
- Question results if the difference between the modeled EUI and the benchmark EUI is outside the acceptable limits. Baseline/budget EUI that is above the benchmark is of especial concern as it may indicate inappropriate simulation assumptions or modeling mistakes that result in overly inefficient/lenient baseline/budget energy use.
- Higher deviations may be justified by project-specific conditions – for example, if project involves a school building that is occupied year-round compared to a benchmark school occupied only during the school year.
SG11-P Modeled Interior Lighting Energy Use of the Proposed Design is Generally Consistent with the Selected Benchmark, with the Difference Less Than Set Threshold
Review Tips
- Refer to 90.1 2022 Section G3.3 Performance Calculations for Other Alterations for notes of caution and tips for alterations subject to 90.1 2022 Section G3.3 (i.e., Minor alterations).
- If the default values in Table 5 of the Energy Performance Summary tab, the “Acceptable Difference Before QC Flag” columns, the “Interior Lighting” row are overwritten, confirm that the entered values are justified. (The over-written defaults are shown in brown font.)
- Question results if the difference between the modeled interior lighting EUI and the benchmark EUI is outside the limits set in the last two columns of Table 6. See #6 in the Types of Review Checks section for the default values. A proposed EUI that is significantly below the benchmark is of especial concern as it may indicate inappropriate simulation assumptions or modeling mistakes that result in optimistic lighting energy use in the proposed design.
- Common reasons and possible mistakes:
- Lighting wattage too high/low
- Lighting runtime hours are too high/low
- Savings from occupancy sensors and daylighting are too high/low
SG11-B Modeled Interior Lighting Energy Use in the Baseline/Budget Design is Generally Consistent with the Selected Benchmark, with Difference Less Than Set Threshold
Review Tips
- Refer to 90.1 2022 Section G3.3 Performance Calculations for Other Alterations for notes of caution and tips for alterations subject to 90.1 2022 Section G3.3 (i.e., Minor alterations).
- If the default values in columns Table 6 of the Energy Performance Summary tab, the “Acceptable Difference Before QC Flag” columns, the “Interior Lighting” row are overwritten, confirm that the entered values are justified. (The over-written defaults are shown in brown font.)
- Question results if the difference between the modeled interior lighting EUI and the benchmark EUI is outside the limits set in the last two columns of Table 6. See #6 in the Types of Review Checks section for the default values. Baseline/budget EUI that is significantly higher than the benchmark is of especial concern as it may indicate inappropriate simulation assumptions or modeling mistakes that result in overly inefficient/lenient baseline/budget design.
- Common reasons and possible mistakes:
- Lighting wattage too high/low
- Lighting runtime hours are too high/low
- Savings from occupancy sensors and daylighting are too high/low
SG12-P, SG12-B Modeled Energy Use Intensity of the Miscellaneous and Process Loads in the Baseline/Budget Design is Generally Consistent with the Selected Benchmark, with the Difference Less Than the Set Threshold
Review Tips
- Refer to 90.1 2022 Section G3.3 Performance Calculations for Other Alterations - Baseline and refer to 90.1 2022 Section G3.3 Performance Calculations for Other Alterations - Proposed for notes of caution and tips for alterations subject to 90.1 2022 Section G3.3 (i.e., Minor alterations).
- If the default values in columns Table 6 of the Energy Performance Summary tab, the “Acceptable Difference Before QC Flag” columns, the “Interior Lighting” row are overwritten, confirm that the entered values are justified. (The over-written defaults are shown in brown font.) See #6 in the Types of Review Checks section for the default values.
- Question results if the difference between the modeled interior lighting EUI and the benchmark EUI is outside the limits set in the last two columns of Table 6. Baseline/budget EUI that is significantly higher than the benchmark is of especial concern as it may indicate inappropriate simulation assumptions or modeling mistakes that result in overly inefficient/lenient baseline/budget design. However, it may be justified by a difference in operating conditions (e.g. longer than typical operating hours), or differences in building use. For example, hotels with dining facilities will have higher miscellaneous equipment EUI than hotels without restaurants.
- Common reasons and possible mistakes:
- Unrealistic miscellaneous equipment loads impact HVAC end uses. For example, unrealistically low loads reduce internal heat gains, over-estimating heating energy use and magnifying the impact of any heating-related trade-offs (e.g., savings from high-performance heating system in the proposed design). On the other hand, cooling energy use is lower than expected minimizing penalty from cooling-related deficiencies in the proposed design, such as when economizer is not specified.
SG13-P, SG13-B Modeled Heating Energy Use in the Proposed and Baseline/Budget Design is Generally Consistent with the Selected Benchmark, with the Difference Less Than the Set Threshold
Review Tips
- Refer to 90.1 2022 Section G3.3 Performance Calculations for Other Alterations - Baseline and refer to 90.1 2022 Section G3.3 Performance Calculations for Other Alterations - Proposed for notes of caution and tips for alterations subject to 90.1 2022 Section G3.3 (i.e., Minor alterations).
- If the default values in Table 6 of the Energy Performance Summary tab (Table 5 for the baseline/budget), the “Acceptable Difference Before QC Flag” columns, the “Space Heating” row are overwritten, confirm that the entered values are justified. (The over-written defaults are shown in brown font.) See #6 in the Types of Review Checks section for the default values.
-
Question results if the difference between the modeled heating EUI and the benchmark EUI is
outside the limits set on the Energy Performance Summary tab, except when heating energy use is
low in both the benchmark and the model, such as for projects in climate zones with minimal
heating.
- Proposed EUI that is significantly lower than the benchmark is of especial concern as it may indicate inappropriate simulation assumptions or modeling mistakes that result in overly optimistic heating energy use in the proposed design.
- Baseline/budget EUI that is significantly higher than the benchmark is of especial concern as it may indicate inappropriate simulation assumptions or modeling mistakes that result in overly inefficient/lenient heating in the baseline/budget design.
-
Common reasons or mistakes that may result in unrealistically high/low heating energy use
intensity include:
- Thermal properties of the envelope are not established or modeled correctly
- Infiltration rate is too high/low
- Window to wall ratio (WWR) is higher (lower) than typical for the building type
- Internal heat gains from lighting, appliances, or plug loads are too low/high
- Excessive simultaneous heating/cooling (simulation outputs show high heating use during summer months, leading to high heating EUI)
- Modeled ventilation rate is too high/low
- Heating efficiency is too low/high
- Heating thermostat setpoints are too high/low
SG14-P, SG14-B Modeled Cooling Energy Use in the Proposed and Baseline/Budget Design is Generally Consistent with the Selected Benchmark, with the Difference Less Than the Set Threshold
Review Tips
- Refer to 90.1 2022 Section G3.3 Performance Calculations for Other Alterations - Baseline and refer to 90.1 2022 Section G3.3 Performance Calculations for Other Alterations - Proposed for notes of caution and tips for alterations subject to 90.1 2022 Section G3.3 (i.e., Minor alterations).
- If the default values in Table 6 of the Energy Performance Summary tab (Table 5 for the baseline/budget), the “Acceptable Difference Before QC Flag” columns, the “Space Cooling” row are overwritten, confirm that the entered values are justified. (The over-written defaults are shown in brown font.) See #6 in the Types of Review Checks section for the default values.
-
Question results if the difference between the modeled cooling EUI and the benchmark EUI is
outside the limits set on the Energy Performance Summary tab, except when the end use is low in
both the benchmark and the model, such as for projects in climate zones with minimal heating.
- Proposed EUI that is significantly lower than the benchmark is of especial concern as it may indicate inappropriate simulation assumptions or modeling mistakes that result in overly optimistic cooling energy use in the proposed design.
- Baseline/budget EUI that is significantly higher than the benchmark is of especial concern as it may indicate inappropriate simulation assumptions or modeling mistakes that result in overly inefficient/lenient cooling energy use in the baseline/budget design.
-
Common reasons or mistakes that may result in unrealistically high/low cooling energy use
intensity:
- Fenestration SHGC is too high/low
- WWR significantly higher (lower) than typical
- Internal heat gains from lighting, appliances, or plug loads are too high/low
- Excessive simultaneous heating/cooling (simulation outputs show high cooling use during winter months, leading to high cooling EUI)
- Modeled ventilation rate is too high/low
- Baseline cooling efficiency is too low/high
- Modeled heating thermostat setpoints are too low/high
- Economizer not modeled or modeled incorrectly
SG15-P, SG15-B Modeled HVAC Fans Energy Use in the Proposed and Baseline/Budget Design is Generally Consistent with the Selected Benchmark, with the Difference Less Than the Set Threshold
Review Tips
- Refer to 90.1 2022 Section G3.3 Performance Calculations for Other Alterations - Baseline and refer to 90.1 2022 Section G3.3 Performance Calculations for Other Alterations - Proposed for notes of caution and tips for alterations subject to 90.1 2022 Section G3.3 (i.e., Minor alterations).
- If the default values in Table 6 of the Energy Performance Summary tab (Table 5 for the baseline/budget), the “Acceptable Difference Before QC Flag” columns, the “Fans” row are overwritten, confirm that the entered values are justified. (The over-written defaults are shown in brown font.) See #6 in the Types of Review Checks section for the default values.
- Question results if the difference between the modeled fan EUI and the benchmark EUI is outside
the limits set on the Energy Performance Summary tab. Focus on the following:
- Proposed EUI that is significantly lower than the benchmark is of especial concern as it may indicate inappropriate simulation assumptions or modeling mistakes that result in overly optimistic fan energy use in the proposed design.
- Baseline/budget EUI that is significantly higher than the benchmark is of especial concern as it may indicate inappropriate simulation assumptions or modeling mistakes that result in overly inefficient/lenient fan energy use in the baseline/budget design.
- Common reasons or mistakes that may result in unrealistically high/low fan energy use intensity:
- Fans are not modeled explicitly (low EUI)
- Fans modeled and reported as process or miscellaneous load (low EUI)
- Exhaust or DOAS fans are modeled in addition to the baseline allowance (high baseline EUI)
- Project includes parking garage with exhaust fans
- Flow controls are not properly modeled (e.g., high EUI if Constant Volume (CV) instead of Variable Air Volume (VAV) control was modeled)
- Minimum flow rates on VAV systems are set too high/low
SG16-P, SG16-B Modeled HVAC Pumps Energy Use in the Proposed and Baseline/Budget Design is Generally Consistent with the Selected Benchmark, with the Difference Less Than the Set Threshold
Review Tips
- Refer to 90.1 2022 Section G3.3 Performance Calculations for Other Alterations - Baseline and refer to 90.1 2022 Section G3.3 Performance Calculations for Other Alterations - Proposed for notes of caution and tips for alterations subject to 90.1 2022 Section G3.3 (i.e., Minor alterations).
- If the default values in Table 6 of the Energy Performance Summary tab (Table 5 for the baseline/budget), the “Acceptable Difference Before QC Flag” columns, the “Pumps” row are overwritten, confirm that the entered values are justified. (The over-written defaults are shown in brown font.) See #6 in the Types of Review Checks section for the default values.
- Question results if the difference between the modeled pump EUI and the benchmark EUI exceeds
the limits. Focus on the following:
- Proposed EUI that is significantly lower than the benchmark is of especial concern as it may indicate inappropriate simulation assumptions or modeling mistakes that result in overly optimistic pump energy use in the proposed design.
- Baseline/budget EUI that is significantly higher than the benchmark is of especial concern as it may indicate inappropriate simulation assumptions or modeling mistakes that result in overly inefficient/lenient pump energy use in the baseline/budget design.
- This check is optional because the difference in pump energy use between the model and the benchmark is often due to differences in the HVAC system type. For example, the model may include geothermal or water-source heat pump or chilled/hot water system while the benchmark may have heating/cooling provided by DX systems with gas furnaces.
-
Common reasons or mistakes that may result in unrealistically high/low pump energy use
intensity:
- Hot or chilled water loops are modeled with constant flow (three-way valves) instead of variable flow (two-way valves).
- Hot water loop is modeled as operating year-round instead of only during the heating season, which is often the case for buildings such as multifamily.
SG17-P, SG17-B Modeled Heat Rejection Energy Use in the Proposed and Baseline/Budget Design is Generally Consistent with the Selected Benchmark, with the Difference Less Than the Set Threshold
Review Tips
- Refer to 90.1 2022 Section G3.3 Performance Calculations for Other Alterations - Baseline and refer to 90.1 2022 Section G3.3 Performance Calculations for Other Alterations - Proposed for notes of caution and tips for alterations subject to 90.1 2022 Section G3.3 (i.e., Minor alterations).
- If the default values in Table 6 of the Energy Performance Summary tab (Table 5 for the baseline/budget), the “Acceptable Difference Before QC Flag” columns, the “Heat rejection” row are overwritten, confirm that the entered values are justified. (The over-written defaults are shown in brown font.) See #6 in the Types of Review Checks section for the default values.
-
Question results if the difference between the modeled heat rejection EUI and the benchmark EUI
exceeds the set limits. Focus on the following:
- Proposed EUI that is significantly lower than the benchmark is of especial concern as it may indicate inappropriate simulation assumptions or modeling mistakes that result in overly optimistic heat rejection energy use in the proposed design.
- Baseline/budget EUI that is significantly higher than the benchmark is of especial concern as it may indicate inappropriate simulation assumptions or modeling mistakes that result in overly inefficient/lenient heat rejection in the baseline/budget design.
- This check is optional because the difference in heat rejection energy use between the model and the benchmark is often due to differences in the HVAC system type. For example, the model may include cooling towers while the benchmark may have heating/cooling provided by DX systems with energy associated with heat rejection reported under cooling end use.
SG18-B, SG18-P Modeled Service Water Heating Energy Use in the Baseline/Budget and Proposed Design is Generally Consistent with the Selected Benchmark, with the Difference Less Than the Set Threshold
Review Tips
- Refer to 90.1 2022 Section G3.3 Performance Calculations for Other Alterations - Baseline and refer to 90.1 2022 Section G3.3 Performance Calculations for Other Alterations - Proposed for notes of caution and tips for alterations subject to 90.1 2022 Section G3.3 (i.e., Minor alterations).
- If the default values in Table 6 of the Energy Performance Summary tab (Table 5 for the baseline/budget), the “Acceptable Difference Before QC Flag” columns, the “Service water heating” row are overwritten, confirm that the entered values are justified. (The over-written defaults are shown in brown font.) See #6 in the Types of Review Checks section for the default values.
- Question results if the difference between the modeled service water heating EUI and the
benchmark exceeds the set limits. Focus on the following:
- Proposed EUI that is significantly lower than the benchmark is of especial concern as it may indicate inappropriate simulation assumptions or modeling mistakes that result in overly optimistic service water heating energy use in the proposed design.
- Baseline/budget EUI that is significantly higher than the benchmark is of especial concern as it may indicate inappropriate simulation assumptions or modeling mistakes that result in overly inefficient/lenient service water heating energy use in the baseline/budget design.
- Common reasons and mistakes that may result in unrealistically high/low service water heating
energy use:
- Hot water demand too high/low
- Water heater efficiency too low/high
SG19-P, SG19-B Modeled Elevator Energy Use in the Baseline/Budget and Proposed Design is Generally Consistent with the Selected Benchmark, with the Difference Less Than the Set Threshold
Review Tips
- Refer to 90.1 2022 Section G3.3 Performance Calculations for Other Alterations - Baseline and refer to 90.1 2022 Section G3.3 Performance Calculations for Other Alterations - Proposed for notes of caution and tips for alterations subject to 90.1 2022 Section G3.3 (i.e., Minor alterations).
- If the default values in Table 6 of the Energy Performance Summary tab (Table 5 for the baseline/budget), the “Acceptable Difference Before QC Flag” columns, the “Elevators and Escalators” row are overwritten, confirm that the entered values are justified. (The over-written defaults are shown in brown font.) See #6 in the Types of Review Checks section for the default values.
- Question results if the difference between the modeled elevator EUI and the benchmark EUI is
outside the set limits. Focus on the following:
- Proposed EUI that is significantly lower than the benchmark is of especial concern as it may indicate inappropriate simulation assumptions or modeling mistakes that result in overly optimistic elevator energy use in the proposed design.
- Baseline/budget EUI that is significantly higher than the benchmark is of especial concern as it
may indicate inappropriate simulation assumptions or modeling mistakes that result in overly
inefficient/lenient elevator energy use in the baseline/budget design.
Projects that have more stories or longer operating hours than the selected benchmark may justifiably have higher elevator energy use.
- Common mistakes that may result in unrealistically high/low elevator energy use:
- Unrealistically high/low modeled elevator runtime hours
SG20 Compliance Outcome is Established Correctly
90.1 2016/2019 ECB
Section 11.2: The energy cost of the proposed design (design energy cost) must not exceed the energy cost budget. Both the design energy cost and the energy cost budget must be based on the completed simulations and may include adjustments based on exceptional calculation methods.
90.1 2022 ECB
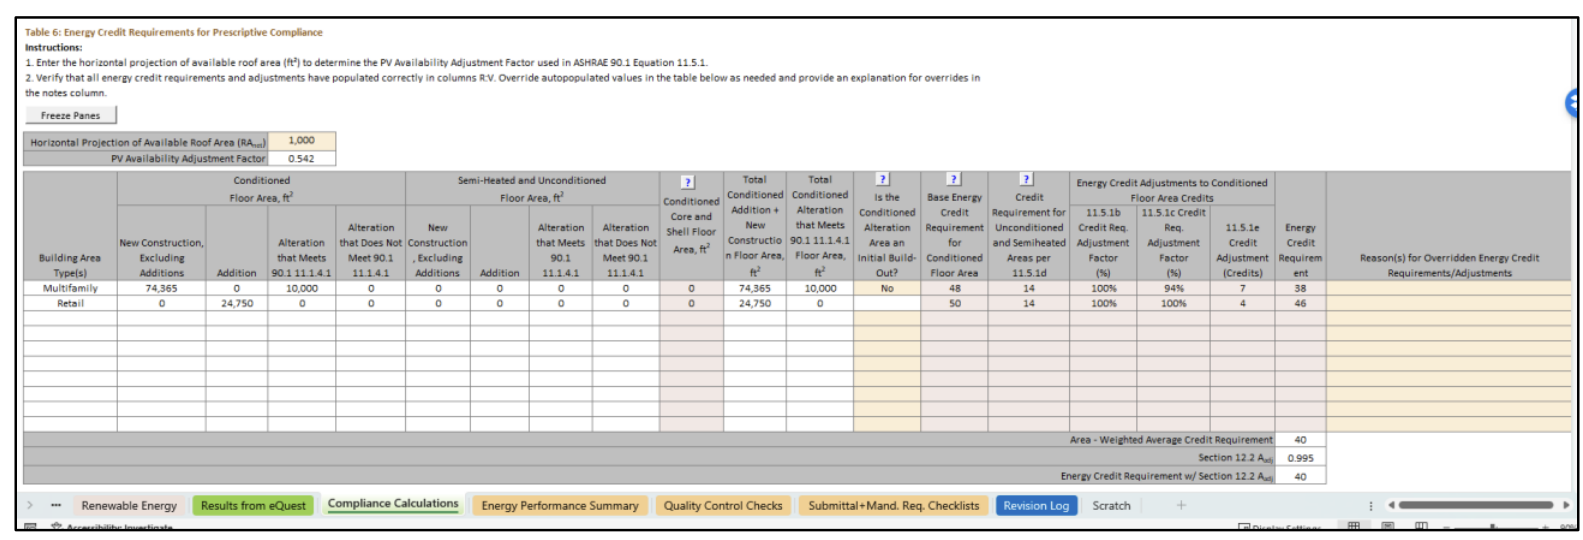
Section 12.2: The energy cost of the proposed design (design energy cost) must not exceed the energy cost budget adjusted for the energy credits required (ECreq) for the building in accordance with Section 11.5.1 and adjusted for if the project includes additions or alterations. See the equation shown below for clarity. Both the design energy cost and the energy cost budget must be based on the completed simulations and may include adjustments based on exceptional calculation methods.
Design Energy Cost ≤ Energy Cost Budget x [1 -ECreq/1000 x Aadj]
Aadj: Where the project includes additions or alterations use an adjustment factor as follows; otherwise use 1.0: (Addition Gross Floor Area + Alteration Gross Floor Area)/ Modeled gross floor area.
90.1 2016 and 2019 PRM
Section 4.2.1.1 c: The section includes the methodology for calculating the Performance Cost Index Target (PCIt). To demonstrate compliance, the project’s Performance Cost Index (PCI) calculated as a ratio of the proposed energy cost to the baseline energy cost, must not exceed the PCIt.
Section 3: regulated energy use is defined as energy used by building systems and components with requirements prescribed in Sections 5 through 10. This includes energy used for HVAC, lighting, service water heating, motors, transformers, vertical transportation, refrigeration equipment, computer-room cooling equipment, and other building systems, components, and processes with requirements prescribed in Sections 5 through 10.
90.1 2022 PRM
Section 4.2.1.1 c: has requirements similar to Section 4.2.1.1 c summarized above with some new additions including that the PCIt calculation requires accounting for the prescriptive on-site renewable energy requirements in Section 10.5.1.1; alterations that meet the criteria in Section G3.1.4(a) apply a multiplier of 1.05 to the building performance factors (BPFs) in 90.1 Table 4.2.1.1 when determining PCIt; and all other alterations (i.e., Minor alterations) subject to 90.1 Section G3.3 use BPF = 1 instead of the BPFs in 90.1 Table 4.2.1.1 when determining PCIt.
Review Tips
Energy Cost Budget Method90.1 2016 and 2019
- The calculation is automated in the Compliance Calculations tab of the Compliance Form based on the simulation results for the budget and proposed design.
90.1 2022
The compliance calculation is automated on the Compliance Calculations tab in the Compliance Form based on the simulation results for the budget and proposed design. However, submitters need to populate the project’s energy credit requirements per Section 11.5.1. Table 6 on the Compliance Calculations tab in the Compliance Form is designed to facilitate this process and for submitters to report the required energy credits. Many values in Table 6 auto-populate, manual overrides are shown in bold orange, review the explanation in the “Reason(s) for Overridden Energy Credit Requirements/Adjustments” for validity if manual overrides have been made.
Performance Rating Method
90.1 2016, 2019 and 2022
- The PCI and PCIt calculations are automated in the Compliance Calculations tab of the Compliance form based on the simulation results for the baseline and proposed design. However, the compliance outcome is strongly influenced by whether the baseline energy cost is properly separated into regulated (BBREC) and unregulated (BBUEC) components, thus the review should focus on verifying that the regulated versus unregulated loads are identified correctly on the Compliance Calculations tab.
-
Reporting regulated load as unregulated makes Appendix G less stringent. Review Table 2 of the
Compliance Tab to verify that regulated loads are not erroneously listed as unregulated. The
table has default regulated/unregulated assignments for common end uses. Review any over-written
defaults (these will be shown in brown font in the “Unregulated?” column of the table).
Below are examples of loads unregulated loads.- Transformers except low-voltage dry-type transformers included in Section 8.4.4.
- Plug-in equipment including but not limited to residential kitchen appliances, consumer and office electronic systems.
- Industrial process equipment with no requirements in 90.1.
- Lighting subject to the exceptions 90.1 Section 9.1.1 including the emergency lighting that is automatically off during normal building operation, lighting that is specifically designated as required by a health or life safety statute, ordinance, or regulation and decorative gas lighting systems.
-
Common mistakes involving reporting regulated loads as unregulated include the following:
- Elevator energy is included in the unregulated “Misc. Equipment” category instead of being separately reported as a regulated load under “Elevators and escalators” end use.
- Parking garage fans are not reported as regulated load in the “Fans - parking garage” end use. (Such fans have requirements in Section 6.4.3.4.5 and must thus be treated as regulated.)
- Energy use of miscellaneous motors covered in 90.1 Section 10 is included under unregulated “Misc. Equipment” category instead of being treated as regulated. (Projects can get credit for exceeding the required efficiency in accordance with Table G3.1 #12.)