Waterside HVAC (WHVAC)
Overview
This group of checks covers water-side HVAC systems including chiller and boiler type, capacity efficiency and controls, chilled and hot water loop pumps and controls, and heat rejection. In addition, there are several checks to verify general consistency between simulation inputs and outputs, such as that when pumps are reported for the baseline/budget or proposed design, simulation results show pump energy use; that if electric resistance heating is reported in the compliance form, simulation results show heating energy use for electricity, etc. Table 17 summarizes the checks included in this group.
The following strategies may be used to prioritize the review:
- Checks should focus on water-side systems with the highest heating or cooling capacity and spot-checking the rest.
- 90.1 Section 6 has mandatory minimums for heating and cooling system efficiencies and ventilation controls. Checks verifying mandatory requirements should be completed where applicable
Table 17: Water-side HVAC Quality Control Checks Overview
WHVAC01-P Proposed chillers reported in the Compliance Form reflect design documents and meet the minimum efficiency requirements.
Review Tips
- Specified chillers are reported in Table 6a of the Proposed HVAC tab.
-
Verify that chiller type, quantity, capacity and rated full and part load efficiency listed in
the table reflect design documents. A reference to the place in the design documents where the
reported information is found must be listed in a dedicated field below the table.
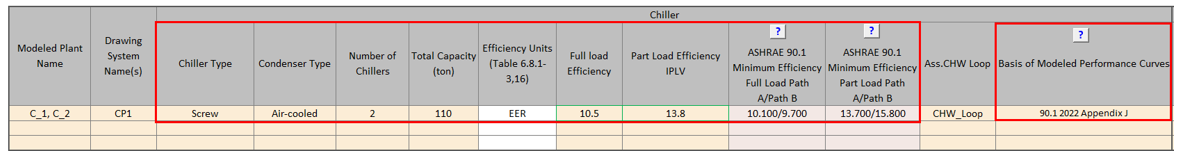
- Verify that efficiency of the specified chillers meets the minimum required in 90.1 Table 6 for either Path A or Path B. The applicable requirements are quoted in Table 6a. If the specified chillers don’t meet the requirements of either Path A or Path B, or if the default minimum requirements are over-written, the submittal must be flagged. These requirements are mandatory and must be met.
-
Variations in chiller performance at a range of operating conditions are typically simulated
using performance curves. The basis of performance curves may include the following:
- 90.1 2022 Appendix J Table J-1 (for 90.1 2022 projects, where part-load performance of chillers in the proposed design is not available 90.1 2022 Appendix J Table J-1 curves must be used)
- PNNL Performance Rating Method Reference Manual
- Custom curves based on chiller performance data from the equipment manufacturer
If custom curves are used, confirm that supporting information is included in the submittal as required (Submittal Checklist #19). The provided curves may be directly reviewed. Alternatively, the annual average achieved chiller efficiency may be verified to confirm general alignment with the rated part load efficiency (see WHVAC03). Reviewer may also request that the default performance curves from 90.1 2022 Appendix J Table J-1 or the PNNL Performance Rating Method Reference Manual for the specified chiller type are used.
WHVAC01–B Properties of the baseline/budget chillers reported in the Compliance Form are established correctly
90.1 2016 and 2019/2022 ECB
Table 11.5.2-1/12.5.2-1 Note e: The chiller plant of budget Systems 1, 2, 5 and 7 must be modeled with chiller quantity based on Table 11.5.2-2/12.5.2-2 and chiller type based on Table 11.5.2-3/12.5.2-3. If the proposed design includes both electric and fossil fuel chillers, the budget building design must have chillers with the same fuel types and capacity allocation between electric and fossil fuel. If the proposed design uses purchased chilled water, the chillers should not be explicitly modeled in the budget design and chilled-water costs shall be as determined in Section 11.4.3/12.4.3. Budget chillers efficiency must be based on Table 6.8.1-3 Path A (11.5.2 b/12.5.2 b).
New in 90.1 2022 Section 12.5.2b the 90.1 Standard now prescribes that the sets of performance curves specified in 90.1 Appendix J Table J-1 should be used to represent part-load performance of chillers in the budget building design.
90.1 2016 and 2019 PRM
Section G3.1.3.7: Baseline Systems 7, 8, 11, 12 and 13 must be modeled with electric chillers, except for projects that use purchased chilled water (Sections G3.1.1.3.2 and G3.1.1.3.3). The number of chillers, chiller type and efficiency must be established based on the baseline peak cooling load as described in Tables G3.1.3.7 and G3.5.3.
90.1 2022 PRM
G3.2 New Construction/Major AlterationsSection G3.2.3.7 requirements are similar to the requirement described above for the 90.1 2016 and 2019 PRM except that G3.2.2.1 now prescribes that the sets of performance curves specified in Appendix J Table J-2 should be used to represent part-load performance of chillers in the baseline building design.
G3.3 Minor Alterations
The systems and equipment included in the scope of retrofit for alterations subject to 90.1 2022
Section G3.3 are required to model the chiller type and quantity the same in the baseline and
proposed. In addition, baseline systems shall meet the requirements in Section 6.1.4 and
chillers shall meet the efficiency requirements in Table 6.8.1-3 using Path A or Path B, the
same as the proposed design. If the proposed design meets both Path A and Path B requirements,
Path A shall be used. The baseline performance curves can be modeled with the sets of
performance curves specified in 90.1 Appendix J Table J-1 to represent part-load performance of
chillers in the baseline building design.
Review Tips – PRM
- Refer to 90.1 2022 Section G3.3 Performance Calculations for Other Alterations for review tips for alterations subject to 90.1 2022 Section G3.3 (i.e., Minor alterations).
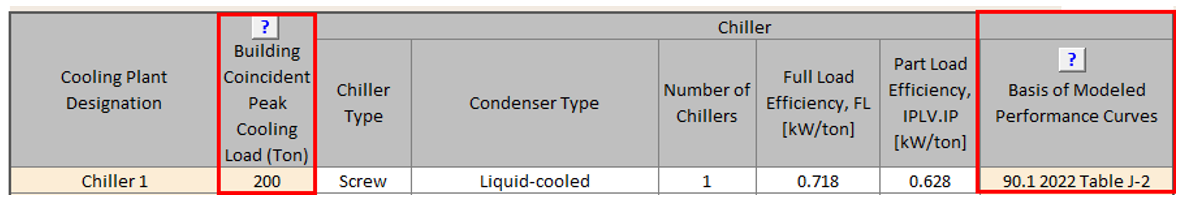
- Baseline chillers are shown in Table 4a on the Baseline HVAC PRM tab. User inputs are limited to the building peak cooling load and the basis of the modeled performance curves. The rest of the fields are auto-populated based on the applicable Appendix G rules and are non-editable.
- Verify that the entered building peak cooling load reflects simulation results for the baseline model.
-
Verify that PNNL Performance Rating Method Reference Manual (PRM RM) is selected as the
basis for baseline performance curves or, for 90.1 2022 projects, the performance curves
specified in 90.1 2022 Appendix J Table J-2.
Review Tips – ECB
-
Chillers included in the budget design are shown in Table 4a of the Budget HVAC ECB tab.
User inputs are limited to the chiller plant capacity, fuel type and the basis of the
modeled performance curves. The rest of the fields are auto-populated based on the
applicable rules of the ECB and are non-editable.
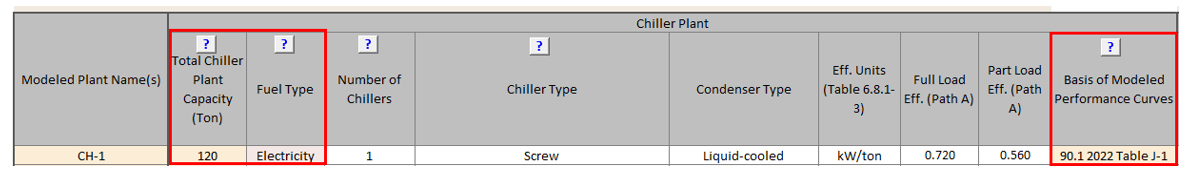
- Verify that the entered chiller capacity reflects simulation results for the budget model.
- For 90.1 2016 and 2019 projects, verify that PNNL Performance Rating Method Reference Manual (PRM RM) is selected as the basis for baseline performance curves or, if the PRM RM curves are not used, verify that the modeled curves are appropriate. For 90.1 2022 projects, verify that “90.1 2022 Appendix J Table J-1” is selected as the “Basis of Modeled Performance Curves”.
WHVAC02-B,P Chillers are modeled as reported in the Compliance Form
Review Tips
- Review simulation reports to verify that the modeled chiller type, capacity and efficiency matches information provided in the Compliance Form. The following conversions may be used if chiller efficiency provided in the Compliance Form is expressed in different units than simulation tool inputs.
EER = COP*3.412
EER = 12/ [kW/ton]
WHVAC03-B,P Average annual realized chiller efficiency is as expected
Review Tips
- Background
The annual average realized chiller efficiency is the ratio of the annual load on the chiller to the annual energy used by the chiller. The average realized efficiency is expected to be similar to chiller part load efficiency. Different than expected average efficiency may be due to the following:
- Inappropriate performance curves (e.g., using software defaults or incorrect custom performance curves)
- Incorrect rated full load efficiency input
- Incorrect CHW loop controls such as design supply water temperature and temperature drop
- Chiller operating conditions are significantly different from AHRI rated conditions.
- The following should be flagged as it may result in overly optimistic compliance outcomes:
- Average realized baseline (budget) chiller efficiency worse than expected
- Average annual realized proposed chiller efficiency better than expected
WHVAC04-P Proposed chilled water loop configuration and temperature controls reported in the Compliance Form reflect design documents.
Review Tips
-
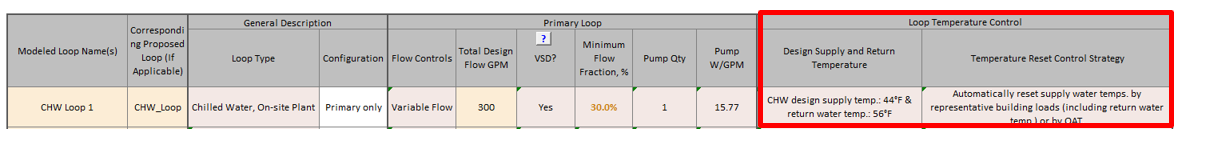
Chilled water (CHW) plant loop arrangement (e.g. primary/secondary) and controls are reported in
Table 5a of the Compliance Form on the Proposed HVAC tab.
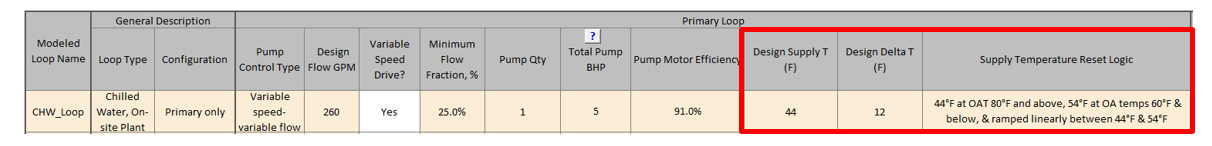
- Verify that the reported CHW loop configuration and controls reported in the Compliance Form reflect design documents. The applicable design documents are referenced in a dedicated field below the table.
WHVAC04–B Baseline/budget chilled water loop configuration and temperature controls reported in the Compliance Form are established correctly
90.1 2016 and 2019/2022 ECB
Table 11.5.2-1/12.5.2-1 Note e: 44°F design chilled-water supply temperature and 56°F return temperature must be modeled. The chilled-water supply water temperature must be reset in accordance with 90.1 Section 6.5.4.4.
90.1 2016 and 2019 PRM
The chilled-water design supply temperature for Systems 7,8,11,12 and 13 must be modeled at 44°F and return water temperature at 56°F (Section G3.1.3.8). Supply temperature must be reset based on outdoor dry-bulb temperature using the following schedule: 44°F at 80°F and above, 54°F at 60°F and below and ramped linearly between 44°F and 54°F at temperatures between 80°F and 60°F (Section G3.1.3.9). Exceptions apply to chilled water systems serving computer rooms or using purchased chilled water (exception to Section G3.1.3.9).
90.1 2022 PRM
G3.2 New Construction/Major AlterationsSection G3.2.3.8 and Section G3.2.3.9 requirements are the same as described above for the 90.1 2016 and 2019 PRM.
G3.3 Minor Alterations
The systems and equipment included in the scope of retrofit for alterations subject to 90.1 2022
Section G3.3 are required to model systems and equipment included in the scope of retrofit at
efficiency levels meeting the mandatory and prescriptive requirements in Section 6.1.4. If there
are no applicable requirements, then the systems and components are modeled identically in the
baseline and proposed. For most alterations 90.1 Section 6.5.4.4 (Chilled- and Hot-Water
Temperature Reset Controls) will not be applicable to the baseline and the reset schedule will
be modeled identically in the baseline and proposed (if there is a reset scheduled specified in
the proposed design). However, if the alteration includes new cooling systems installed to serve
previously uncooled spaces, then the baseline is required to be modeled as meeting the minimum
requirements of 90.1 Section 6.5.4.4 (Chilled- and Hot-Water Temperature Reset Controls).
Review Tips
-
CHW plant loop arrangement and controls are reported in Table 6a of the Budget HVAC ECB tab
(shown) or Table 6a of the Baseline HVAC PRM tab, depending on the compliance path followed by
the project. The inputs are auto-populated based on the applicable requirements of 90.1.
Over-written defaults are shown in brown font and should be verified. Refer to
90.1 2022 Section G3.3 Performance Calculations for Other Alterations
for review tips for alterations subject to 90.1 2022 Section G3.3 (i.e., Minor alterations).
WHVAC05-B,P Chilled water loop configuration and temperature controls are modeled as reported in the Compliance Form
Review Tips
- Use simulation reports to verify that the modeled chilled water loop configuration (i.e. primary/secondary) and temperature controls are modeled as reported in the Compliance Form.
WHVAC06-P Proposed chilled water pump system parameters reported in the Compliance Form reflect design documents
Review Tips
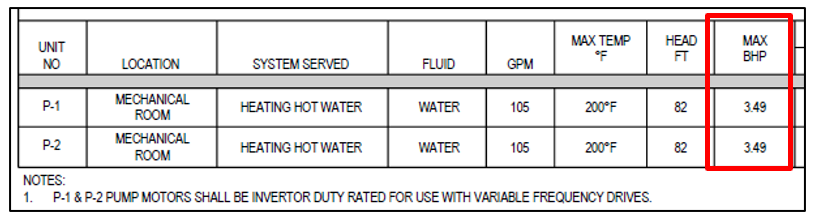
-
Details of the specified CHW pumps are reported in Table 5a of the Proposed HVAC tab. Verify
alignment between Compliance Form and design documents. (The applicable design documents must be
listed below the table.)
-
If values provided on drawings (Figure 42) must be expressed in different units, the conversions
must be documented in the submittal. Common conversions are included below.
Pump Power [W] = BHP*746 / Effy
Effy = pump motor efficiency
Figure 42: Pump Design
WHVAC06–B Baseline/budget chilled water pump system parameters reported in the Compliance Form are established correctly
90.1 2016 and 2019/2022 ECB
Table 11.5.2-1/12.5.2-1 Note e: The pump system power for each pumping system shall be the same as for the proposed design. If the proposed design has no chilled-water pumps, the budget building design pump power shall be 22 W/gpm (equal to a pump operating against a 75 ft head, 65% combined impeller and motor efficiency). The chilled-water system shall be modeled as primary-only variable flow with flow maintained at the design rate through each chiller using a bypass. Chilled-water pumps must be modeled as riding the pump curve or with variable-speed drives when required in 90.1 Section 6.5.4.2. Each chiller shall be modeled with separate condenser water and chilled-water pumps interlocked to operate with the associated chiller.
90.1 2016 and 2019 PRM
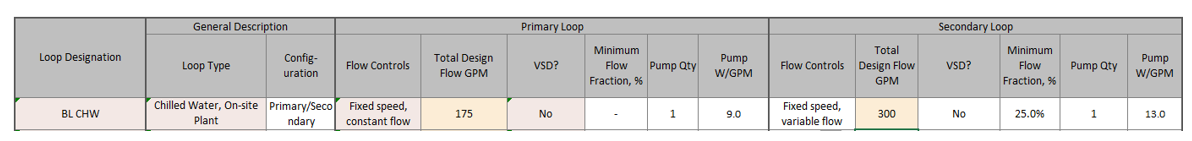
Section G3.1.3.10 Chilled-water systems shall be modeled as primary/secondary with constant flow primary loop and variable-flow secondary loop. For systems with a cooling capacity of 300 tons or more, the secondary pump shall be modeled with variable-speed drives and a minimum flow of 25% of the design flow rate. For systems with less than 300 tons cooling capacity, the secondary pump shall be modeled as riding the pump curve. The baseline building constant-volume primary pump power shall be modeled as 9 W/gpm and the variable-flow secondary pump power shall be modeled as 13 W/gpm at design conditions. See Section G3.1.3.10 for chilled water pump system parameters for baseline systems serving computer rooms (System 11) and projects with purchased chilled water (Section G3.1.1.3.2 and G3.1.1.3.3).
90.1 2022 PRM
G3.2 New Construction/Major AlterationsSection G3.2.3.10 requirements are the same as described above for the 90.1 2016 and 2019 PRM Section G3.1.3.10.
G3.3 Minor Alterations
The systems and equipment included in the scope of retrofit for alterations subject to 90.1 2022
Section G3.3 (i.e., Minor Alterations) are required to model systems and equipment included in
the scope of retrofit at efficiency levels meeting the mandatory and prescriptive requirements
in Sections 6 and 10. Section 10.1.4 includes minimum motor efficiency requirements that should
be modeled for the pump motors included in the scope of the alteration in the baseline. 90.1
Section 6 requirements depend on the scope of the alteration and the language in 90.1 Section
6.1.4. With regard to 90.1 Section 6, if there are no applicable requirements then the systems
and components are modeled identically in the baseline and proposed. For most alterations 90.1
Section 6.5.4.2 (Hydronic Variable Flow Systems) will not be applicable to the baseline and the
flow systems and controls will be modeled identically in the baseline and proposed. However, if
the alteration includes new cooling systems installed to serve previously uncooled spaces, then
the baseline is required to be modeled as meeting the minimum requirements of 90.1 Section
6.5.4.2 (Hydronic Variable Flow Systems).
Review Tips
-
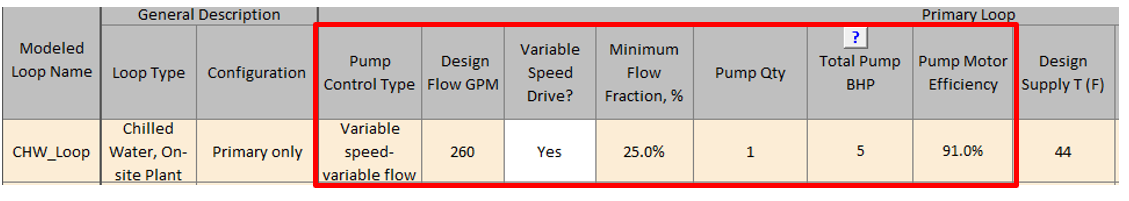
Parameters of the baseline CHW pumps are reported in Table 6a of the Baseline HVAC PRM tab
(shown) or Budget HVAC ECB tab. All required inputs are auto-populated based on the applicable
90.1 rules. Over-written defaults should be checked. Refer to
90.1 2022 Section G3.3 Performance Calculations for Other Alterations
for review tips for alterations subject to 90.1 2022 Section G3.3 (i.e., Minor alterations).
WHVAC07–B,P CHW pumps are modeled as reported in the Compliance Form
Review Tips
- Review simulation reports to verify that chilled water pumps were modeled as reported in the Compliance form including pump design flow (GPM), power (kW, or BHP and motor efficiency) and flow control (one/two speed, VSD).
WHVAC08-B,P CHW loops flow control is modeled as reported in the Compliance Form
Review Tips
- Review simulation reports to confirm that CHW loop configuration (i.e. primary/secondary), design flow (GPM) and flow control (three-way or two-way valves) are modeled as reported in the Compliance Form.
WHVAC09-B,P Modeled annual chilled water pump energy is as expected
Review Tips
-
Background: Pump energy depends on pump design BHP, pump motor efficiency, whether the flow is
constant or variable, with two-way valves in the loop, whether there is a VSD on pump motor and
VSD controls such as differential pressure reset. The typical power draw at part load conditions
is shown in Table 7, based on the same part load operation assumptions as for the part load
cooling efficiency (IPLV), including 1% at 100% of the load, 42% at 25% of the load, 45% at 50%
of the load and 12% at 25% of the load).
Table 7: Pump Performance at Part Load Conditions
Ppump/Pdesign 100% 90% 80% 70% 60% 50% 40% 30% 25% 20% 10% Avg % Riding Curve 1.03 0.92 0.86 0.82 0.79 0.75 0.70 0.62 0.56 0.48 0.28 0.78 VSD, no reset 1.01 0.81 0.64 0.51 0.39 0.30 0.23 0.16 0.14 0.11 0.05 0.43 VSD, pd reset 1.01 0.77 0.57 0.41 0.28 0.18 0.11 0.06 0.04 0.03 0.01 0.34 Ppump [W] = pump power at part load
Pdesign [W] = pump power at design load
The annual pump energy use may be estimated as follows:
PEU= Pdesign * Avg% * HRS
PEU [kWh] = estimated annual pump energy use
HRS = number of hours per year the building is occupied
Avg% = the average pump power draw from Table 7 depending on pump capacity control
- Compare simulated pump energy use to PEU estimated above. The following should be flagged:
- Simulated baseline pump energy use exceeding estimated PEU by more than 25%
- Simulated proposed pump energy use below 75% of the estimated PEU
WHVAC10–P Proposed heat rejection system reported in the Compliance Form reflects design documents
Review Tips
- Parameters of the proposed condenser water (CW) loop are reported in Table 5a of the Proposed HVAC tab. Verify that information included in the Compliance Form reflects design documents.
- Cooling tower details are reported in Table 6a of the Proposed HVAC tab. Verify that information included in the Compliance Form reflects design documents.
WHVAC10–B Baseline/budget heat rejection system reported in the Compliance Form is established correctly
90.1 2016 and 2019/2022 ECB
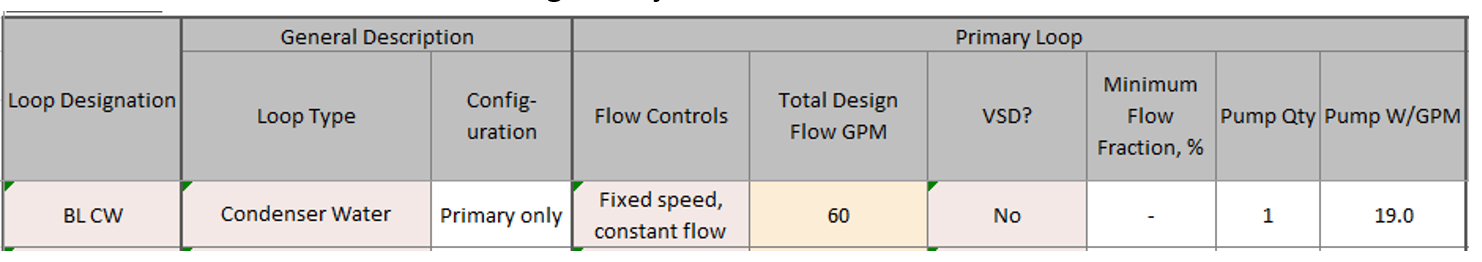
Table 11.5.2-1/12.5.1-1 Note e: The heat-rejection device is an open-circuit axial-fan cooling tower with variable-speed fan control if required in 90.1 Section 6.5.5 and must meet the performance requirements of 90.1 Table 6.8.1-7. Condenser water design supply temperature and controls must be as described in 90.1 Table 11.5.2-1/12.5.1-1 Note e. Pump system power for each pumping system shall be the same as the proposed design; if the proposed design has no condenser water pumps, the budget building design pump power must be 19 W/gpm (equal to a pump operating against a 60 ft head, 60% combined impeller and motor efficiency).
90.1 2016 and 2019 PRM
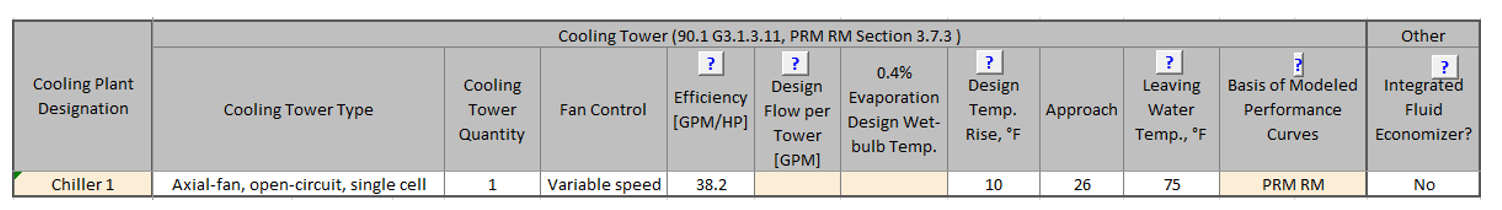
Section G3.1.3.11 The heat-rejection device is an axial-fan open-circuit cooling tower with variable speed fan control and efficiency of 38.2 gpm/hp at the conditions specified in 90.1 Table 6.8.1-7. Temperature controls must be as described in 90.1 Section G3.1.3.11 and 90.1 Table G3.1.3.11. The condenser-water pump power shall be 19 W/gpm and modeled as constant volume.
90.1 2022 PRM
G3.2 New Construction/Major AlterationsSection G3.2.3.11: Requirements are the same as described above for 90.1 2016 and 2019 PRM Section G3.1.3.11.
G3.3 Minor Alterations
The systems and equipment included in the scope of retrofit for alterations subject to 90.1 2022
Section G3.3 are required to model heat rejection system parameters as minimally compliant with
90.1 2022 Section 6.1.4 in the baseline. This, at minimum, includes modeling the heat rejection
equipment as minimally compliant with 90.1 Table 6.8.1-7 and 90.1 Section 6.5.5.2 which includes
requirements for fan speed control. Other baseline requirements may be triggered in the case
where a new cooling system is being installed to serve previously uncooled spaces as this makes
it such that all 90.1 Section 6 mandatory and prescriptive requirements are applicable to
establishing baseline modeling parameters. In all cases, the same type of heat rejection
equipment shall be modeled in the baseline and proposed.
Review Tips – PRM
- Refer to 90.1 2022 Section G3.3 Performance Calculations for Other Alterations for review tips for alterations subject to 90.1 2022 Section G3.3 (i.e., Minor alterations).
-
Baseline cooling tower(s) are described in Table 4a of the Baseline HVAC PRM tab. The
prescribed inputs are auto-populated based on the applicable 90.1 rules and are
non-editable.
-
Baseline condenser loop is described in Table 6a of the Baseline HVAC PRM tab. The
prescribed fields are auto populated based on 90.1 rules. Over-written defaults are shown in
brown font and should be verified to confirm that changes are justified.
Review Tips – ECB
- Budget cooling tower(s) are described in Table 4a of the Budget HVAC ECB tab. Budget condenser water loop parameters are shown in Table 6a. The prescribed inputs are auto-populated with default based on the applicable rules of the ECB. Over-written defaults are shown in brown font and should be verified to confirm that changes are justified.
WHVAC11-B,P Heat rejection system is modeled as reported in the Compliance Form
Review Tips
Verify that modeled parameters of the heat rejection system(s) are as reported in the Compliance Form.
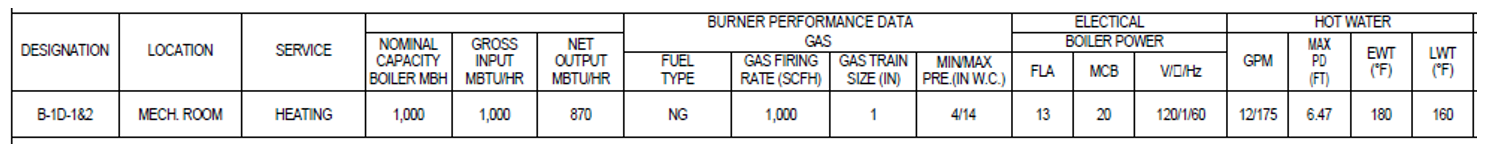
WHVAC12-P Proposed space heating boilers reported in the Compliance Form reflect design documents and meet the minimum efficiency requirements
Review Tips
- Specified space heating boilers are reported in Table 7a of the Proposed HVAC tab.
-
Confirm that reported boiler type, fuel source, quantity, capacity and efficiency reflect design
documents. The design documents where the information may be found (e.g. drawing number) must be
included in a dedicated field below the table.
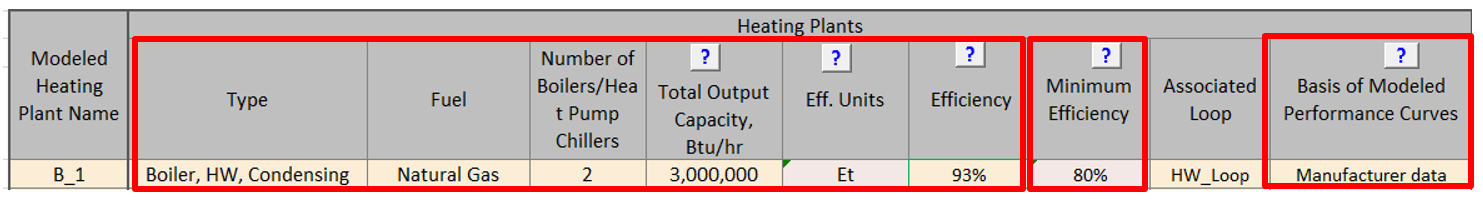
- Verify that efficiency of the specified spacy heating boilers meets 90.1 minimum efficiency requirements. (The applicable requirements are quoted in Table 7a.) If the specified boilers have lower efficiency or if the default minimum requirements are over-written, the submittal must be flagged. These requirements are mandatory and must be met.
-
Variations in boiler performance at a range of operating conditions are typically simulated
using performance curves. The basis of the modeled performance curves may include the following:
- PNNL Performance Rating Method Reference Manual
- Custom curves based on chiller performance data from the equipment manufacturer.
If custom curves are used, confirm that supporting information is included in the submittal as required (Submittal Checklist #21). The provided curves may be directly reviewed. Alternatively, the annual average achieved boiler efficiency may be verified to confirm general alignment with the rated efficiency (see WHVAC14). Reviewer may also request that the default performance curves from PNNL Performance Rating Method Reference Manual for the specified boiler type are used.
WHVAC12–B Properties of the space heating boilers in the budget/baseline design reported in the Compliance Form are established correctly
90.1 2016 and 2019/2022 ECB
G3.2 New Construction/Major AlterationsTable 11.5.2 – 1/Table 12.5.2 – 1, Note f: The budget building design boiler plant must be modeled with a single boiler if the budget building design plant load is 600,000 Btu/h or less and with two equally sized boilers for plant capacities exceeding 600,000 Btu/h. Boilers must be staged as required by the load. Boilers must use the same fuel as the proposed building design and be natural draft. Boiler efficiency must be the minimum required in 90.1 Table 6.8.1-6. If the proposed design uses purchased hot water or steam, then purchased water or steam must also be used in the budget design in lieu of boilers and the hot-water or steam costs must be based on actual utility rates.
90.1 2016 and 2019 PRM
Section G3.1.3.2: The boiler plant for baseline System 1, 5 and 7 must be natural draft and use natural gas. If natural gas is not available on-site as determined by AHJ, the boiler plant must use propane. Purchased heat must be modeled in the baseline instead of on-site boiler for projects that use purchased heat in the proposed design (Section G3.1.1.1). The on-site baseline boiler plant must be modeled with a single boiler if the baseline plant serves a conditioned floor area of 15,000 ft2 or less and with two equally sized boilers for plants serving more than 15,000 ft2 . The boilers must be staged as required by the load.
90.1 2022 PRM
G3.2 New Construction/Major AlterationsSection G3.2.3.2 requirements are the same as described above for the 90.1 2016 and 2019 PRM Section G3.1.3.2.
G3.3 Minor Alterations
Section G3.2.3.2 Alterations subject to Section G3.3 are required to model the
same quantity and type of boiler in the baseline and proposed models. Boiler efficiency shall be
modeled with the minimum requirements of Table 6.8.1-6 in the baseline.
Review Tips
-
For PRM projects, the baseline space heating boilers are reported in Table 5a of the Baseline
HVAC PRM tab (shown). For ECB projects, budget design boilers are shown in Table 5a of the
Budget HVAC ECB tab. Refer to
90.1 2022 Section G3.3 Performance Calculations for Other Alterations
for review tips for alterations subject to 90.1 2022 Section G3.3 (i.e., Minor alterations).
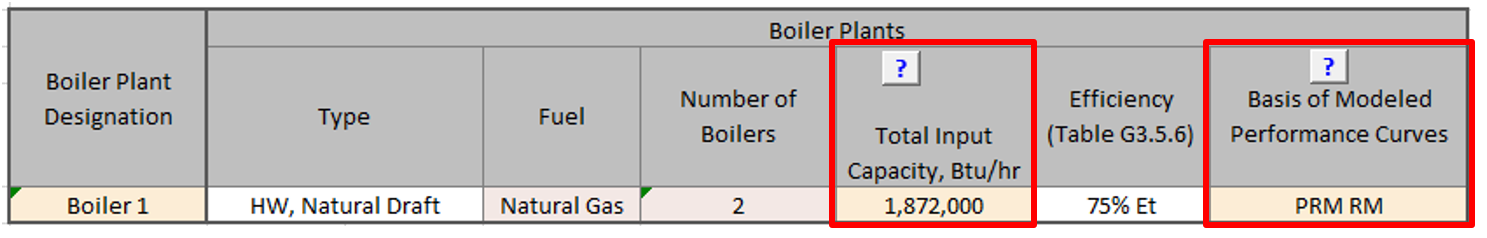
The fields are auto-populated except for the following:
- Total Input Capacity is a user input and must reflect sizing determined in the baseline model. See WHVAC13 for the applicable simulation reports.)
- Basis of the modeled performance curves must be set to Performance Rating Method Reference Manual (PRM RM). While the performance curves are not prescribed in 90.1, PRM RM reflect the industry standard defaults.
Overwritten defaults (if any) are shown in brown font and should be flagged by reviewer.
WHVAC13-B,P Space heating boilers are modeled as reported in the Compliance Form
Review Tips – ECB
The proposed boiler quantity, type, capacity and efficiency is modeled as reported. The following relationships may be used when necessary to convert between different efficiency units:
- From AFUE to Et:
75%<=AFUE<80%: Et=0.1xAFUE+72.5%
all other: Et=0.875 x AFUE + 10.5%
- From Ec to Et: Et=Ec-2%
WHVAC14–B,P Average annual realized boiler efficiency is as expected
Review Tips
- Background
The annual average realized boiler efficiency is the ratio of the annual load on the boiler to the annual boiler energy use, as shown on simulation output reports. The average realized efficiency is expected to be lower than the rated efficiency. For example, the rated efficiency of condensing boilers corresponds to 80F return water temperature. A much higher design return water temperature is common (see WHVAC15-P), resulting in a significantly lower realized efficiency of condensing boilers, as illustrated below based on manufacturer data for a sample unit.
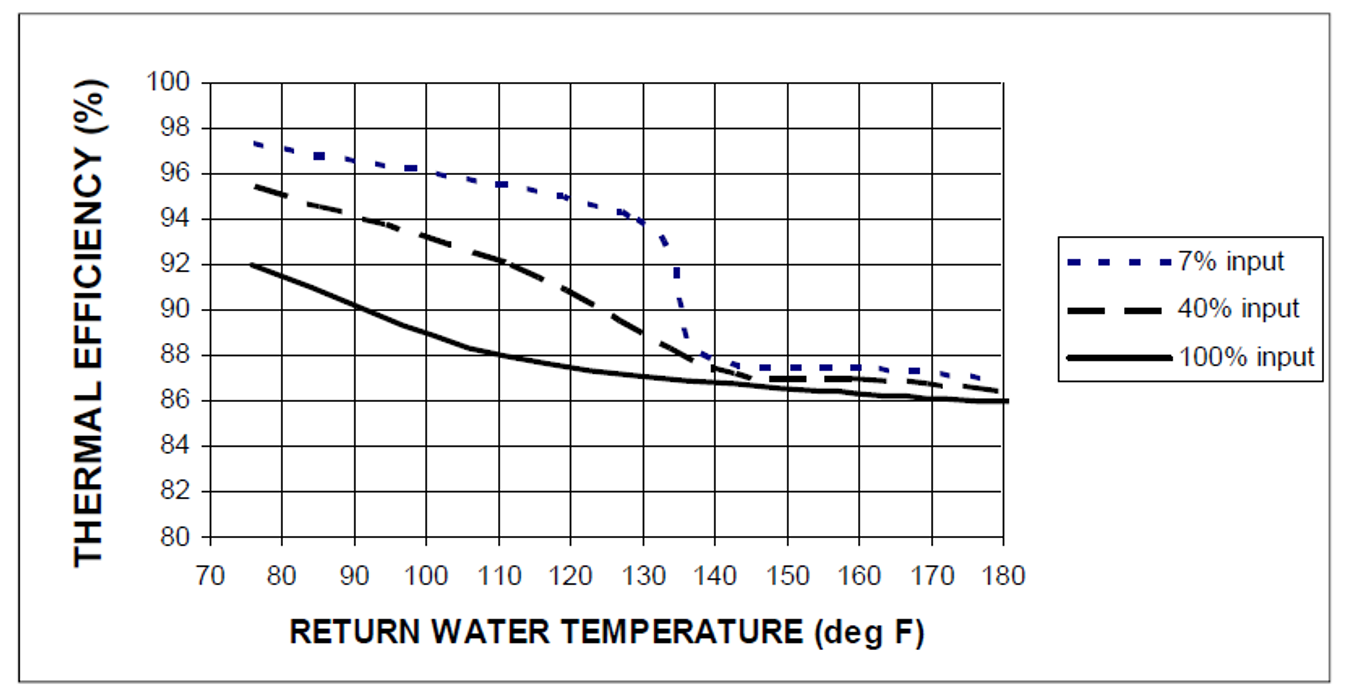
- Common Mistakes
-
Average annual realized efficiency over 86% for condensing boilers included in the
proposed designs that with the specified return water temperature of 160F should be
flagged as it is likely overly optimistic. Review comment should request cut sheets for
the boiler with AHRI efficiency and performance characteristics at various return water
temperature and loads to justify the modeled performance. Higher than expected average
efficiency may be due to the following:
- Inappropriate performance curves (e.g., using software defaults or incorrect custom performance curves)
- Incorrect rated full load efficiency input
- Incorrect HW loop controls such as lower than specified supply water temperature or higher than specified design temperature drop
-
Budget/baseline space heating boilers are natural draft (for alterations subject to 90.1
2022 Section G3.3 (i.e., Minor Alterations) the baseline boiler type will depend on and
be identical to the type specified in the proposed design). The average realized annual
efficiency below 72% / 68% for the natural draft boilers that have 80% / 75% rated
efficiency should be flagged. The expected part load efficiency degradation of such
boilers based on the performance curves in PRM RM results in the efficiencies shown in
Table 18. The annual average efficiency of a boiler that operates at 75% of design
capacity 43% of the time, 50% of design capacity 45% of the time and 25% of design
capacity 12% of the time is shown in Typ. Avg. column of Table 9. The average annual
boiler efficiency that is lower than expected should be flagged and may be due to the
following:
- Budget/baseline boilers are oversized by more than 25% and run at low part load for most of the year.
- Budget/baseline boilers are not controlled correctly in the model.
- Inappropriate performance curves (e.g., using software defaults or incorrect custom performance curves)
-
Average annual realized efficiency over 86% for condensing boilers included in the
proposed designs that with the specified return water temperature of 160F should be
flagged as it is likely overly optimistic. Review comment should request cut sheets for
the boiler with AHRI efficiency and performance characteristics at various return water
temperature and loads to justify the modeled performance. Higher than expected average
efficiency may be due to the following:
Table 18: Natural Draft Boiler Efficiency at Part Load Conditions
| % of Design Load | 100% | 90% | 80% | 70% | 60% | 50% | 40% | 30% | 25% | Typ. Avg. |
|---|---|---|---|---|---|---|---|---|---|---|
| 80% efficient boiler (Note 1) | 80% | 79% | 77% | 76% | 74% | 71% | 68% | 64% | 61% | 72% |
| 75% efficient boiler (Note 2) | 75% | 74% | 72% | 71% | 69% | 67% | 64% | 60% | 57% | 68% |
Note 1: All ECB budget boilers and PRM baseline boilers with heating capacity over 2,500 kBtu/h or under 300 kBtu/h
Note 2: PRM baseline boilers with 300 kBtu/h – 2,500 kBtu/h
WHVAC15-P Proposed hot water loop configuration temperature controls reported in the Compliance Form reflect design documents
Review Tips
-
The configuration (primary/secondary) and temperature controls of the specified hot water loops
are shown in Table 5a of the Proposed HVAC tab.
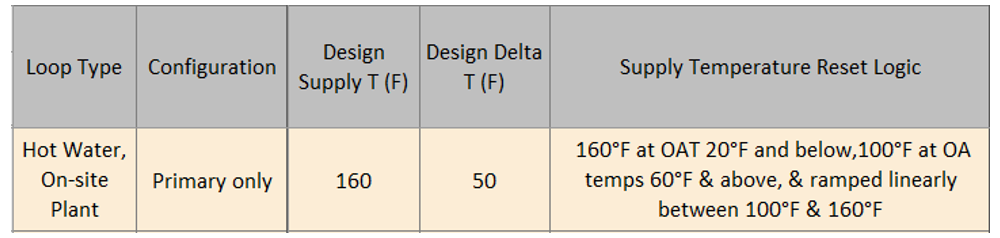
-
Verify that the reported hot water loop configuration and controls including design supply and
return water temperature and temperature reset reflect design documents. Controls may have a
significant impact on the realized efficiency. For example, the rated efficiency of condensing
boilers corresponds to 80F return water temperature. A much higher design return water
temperature is common, such as 160 F shown below, resulting in a significantly lower realized
efficiency (see WHVAC13).
WHVAC15–B Budget/baseline hot water loop configuration and temperature controls reported in the Compliance Form are established correctly
90.1 2016 and 2019/2022 ECB
Table 11.5.2 – 1/Table 12.5.2 – 1, Note f: The hot-water space heating loop must be modeled with 180°F design supply temperature and 130°F return temperature. The supply water temperature must be reset in accordance with 90.1 Section 6.5.4.4.
90.1 2016 and 2019 PRM
The hot-water space heating loop must be modeled with 180°F design supply and 130°F design return temperature (90.1 Section G3.1.3.3). Hot-water supply temperature must be reset based on outdoor dry-bulb temperature using the following schedule: 180°F at 20°F and below, 150°F at 50°F and above and ramped linearly between 180°F and 150°F at temperatures between 20°F and 50°F (G3.1.3.4). See Exception to 90.1 Section G3.1.3.4 for projects that use purchased heat in the proposed design.
90.1 2022 PRM
G3.2 New Construction/Major Alterations90.1 Section G3.2.3.3 and G3.2.3.4 requirements are the same as described above for the 90.1 2016 and 2019 PRM.
G3.3 Minor Alterations
The systems and equipment included in the scope of retrofit for alterations subject to 90.1 2022
Section G3.3 are required to model systems and equipment included in the scope of retrofit at
efficiency levels meeting the mandatory and prescriptive requirements in Section 6.1.4. If there
are no applicable requirements, then the systems and components are modeled identically in the
baseline and proposed. For most alterations 90.1 Section 6.5.4.4 (Chilled- and Hot-Water
Temperature Reset Controls) will not be applicable to the baseline and the reset schedule will
be modeled identically in the baseline and proposed (if there is a reset scheduled specified in
the proposed design). However, if the alteration includes new cooling systems installed to serve
previously uncooled spaces, then the baseline is required to be modeled as meeting the minimum
requirements of 90.1 Section 6.5.4.4 (Chilled- and Hot-Water Temperature Reset Controls).
Review Tips
- HW plant loop arrangement and controls are reported in Table 6a of the Budget HVAC ECB tab (shown) or Table 6a of the Baseline HVAC PRM tab, depending on the compliance path followed by the project. The inputs are auto-populated based on the applicable requirements of 90.1. Over-written defaults are shown in brown font and should be verified. For alterations subject to 90.1 Section G3.3 (i.e., Minor Alterations) examine Table 5a on the Proposed HVAC tab for the parameters that should be modeled in the baseline and proposed.
WHVAC16-B,P Hot water loops temperature controls are modeled as reported in the Compliance Form
Review Tips
Use simulation reports to verify that the modeled hot water loop configuration and controls such as supply and return hot water temperature and temperature reset are modeled as reported in the Compliance Form.
WHVAC17–P Proposed hot water pump system parameters reported in the Compliance Form reflect design documents
Review Tips
- Details of the specified HW pumps are reported in Table 5a of the Proposed HVAC tab. Verify alignment between Compliance Form and design documents. (The applicable design documents must be listed below the table.)
WHVAC17–B Baseline/budget hot water pumps reported in the Compliance Form are established correctly
90.1 2016 and 2019/2022 ECB
Table 11.5.2 – 1/12.5.2-1, Note f: Pump system power for each pumping system must be the same as for the proposed building design; if the proposed building design has no hot-water pumps, the budget building design pump power must be 19 W/gpm, which is equal to a pump operating against a 60 ft head, 60% combined impeller and motor efficiency. The hot-water system shall be modeled as primary-only with continuous variable flow. The hot-water pumps must be modeled as riding the pump curve or with variable-speed drives when required by 90.1 Section 6.5.4.2.
90.1 2016 and 2019 PRM
Section G3.1.3.5: The baseline building design hot-water pump power must be 19 W/gpm. The pumping system must be primary-only with continuous variable flow and a minimum of 25% of the design flow rate. Hot-water systems serving 120,000 ft2 or more must be modeled with variable-speed drives and systems serving less than 120,000 ft2 must be modeled as riding the pump curve.
90.1 2022 PRM
G3.2 New Construction/Major AlterationsSection G3.2.3.5 requirements are the same as described above for the 90.1 2016 and 2019 PRM Section G3.1.3.5.
G3.3 Minor Alterations
The systems and equipment included in the scope of retrofit for alterations subject to 90.1 2022
Section G3.3 (i.e., Minor Alterations) are required to model systems and equipment included in
the scope of retrofit at efficiency levels meeting the mandatory and prescriptive requirements
in Sections 6 and 10. Section 10.1.4 includes minimum motor efficiency requirements that should
be modeled for the pump motors included in the scope of the alteration in the baseline. 90.1
Section 6 requirements depend on the scope of the alteration and the language in 90.1 Section
6.1.4. With regard to 90.1 Section 6, if there are no applicable requirements then the systems
and components are modeled identically in the baseline and proposed. For most alterations 90.1
Section 6.5.4.2 (Hydronic Variable Flow Systems) will not be applicable to the baseline and the
flow systems and controls will be modeled identically in the baseline and proposed. However, if
the alteration includes new cooling systems installed to serve previously uncooled spaces, then
the baseline is required to be modeled as meeting the minimum requirements of 90.1 Section
6.5.4.2 (Hydronic Variable Flow Systems).
Review Tips
- Parameters of the baseline HW pumps are reported in Table 6a of the Baseline HVAC PRM tab (shown) or Budget HVAC ECB tab. All required inputs are auto-populated based on the applicable 90.1 rules. Over-written defaults should be checked. Refer to 90.1 2022 Section G3.3 Performance Calculations for Other Alterations for review tips for alterations subject to 90.1 2022 Section G3.3 (i.e., Minor alterations).
WHVAC18-B,P Hot water pumps are modeled as reported in the Compliance Form
Review Tips
- Review simulation reports to verify that hot water pumps were modeled as reported in the Compliance form including pump design flow (GPM), power (kW, or BHP and motor efficiency) and flow control (one/two speed, VSD).
WHVAC19-B,P Hot water loops flow control is modeled as reported in the Compliance Form
Review Tips
- Review simulation reports to confirm that HW loop configuration (i.e. primary/secondary), design flow (GPM) and flow control (three-way or two-way valves) are modeled as reported in the Compliance Form.
WHVAC20-B,P Modeled annual hot water pump energy is as expected
Review Tips
- Follow the steps described for WHVAC09 to confirm that the modeled annual hot water pump energy is as expected.
WHVAC21 Pump energy use is reported on the Compliance Calculations tab if applicable.
Review Tips
-
If proposed/budget/baseline design includes chilled water, hot water or condenser loops based on
the information reported in the Compliance Form (as noted below), pumps are expected to be
modeled and non-zero “Pump” end use in expected to be reported on the Compliance Calculations
tab Table 2. Loops are found on the following locations within the Compliance Form:
- Proposed HVAC tab Table 5a (Examine the Notes field under the table for notes as to what was modeled in the baseline design model for 90.1 2022 alterations subject to G3.3)
- Baseline HVAC PRM tab Table 6a
- Budget HVAC ECB tab Table 6a
- The following should be flagged in the review comments:
- Model is expected to have pumps, but no pump energy is reported
- Model is not expected to have pumps, but pump energy is reported.
WHVAC22 Modeled budget/baseline and proposed heating energy use by fuel is consistent with heating energy source reported in the Compliance Form
Review Tips – ECB
- When Section 11.5.2 j (12.5.2 j in 90.1 2022) is properly applied to determine the budget HVAC system, the allocation of heating and cooling energy use between fuels is expected to be similar in the budget building and the proposed design. For example, if based on the simulation output reports about one third of the annual heating MMBtu is associated with natural gas and two thirds with electricity, similar allocation is expected in the budget design. Explanation should be requested when allocation of heating energy use between fuels differ by more than 15% in the budget design vs proposed design. For example, if in the budget design heating energy MMBtu are split 50/50 between electricity and gas, and in the proposed design the split is 30/70.
- All fuel types reported in the Proposed HVAC tab Table 1a or 7a should have the corresponding modeled energy use reported for the proposed design in the Compliance Calculations tab Table 2. All fuel types that are not listed in the above-referenced tables of the Proposed HAC tab are expected to have no energy user reported in the Compliance Calculations tab.
- All heating fuels reported in the Budget HVAC ECB tab Table 1a or 5a should have the corresponding modeled energy use reported for the budget design in the Compliance Calculations tab Table 2. All fuel types that are not listed in the above-referenced tables of the Proposed HAC tab are expected to have no energy user reported in the Compliance Calculations tab.
Review Tips – PRM
- Refer to 90.1 2022 Section G3.3 Performance Calculations for Other Alterations for review tips for alterations subject to 90.1 2022 Section G3.3 (i.e., Minor alterations).
- All fuel types reported in the Proposed HVAC tab Table 1a or 7a should have the corresponding modeled energy use reported for the proposed design in the Compliance Calculations tab Table 2. All fuel types that are not listed in the above-referenced tables of the Proposed HAC tab are expected to have no energy user reported in the Compliance Calculations tab.
- All heating fuels reported in the Baseline HVAC PRM tab Table 1a or 5a should have the corresponding modeled energy use reported for the budget design in the Compliance Calculations tab Table 2. All fuel types that are not listed in the above-referenced tables of the Proposed HAC tab are expected to have no energy user reported in the Compliance Calculations tab.
- Common mistake includes modeling electric heating in the baseline for projects located in climate zones 3B, 3C and 4-8. Based on 90.1 Table G3.1.1-3 and G3.1.1-4, such projects should have no electric heating in the baseline model.